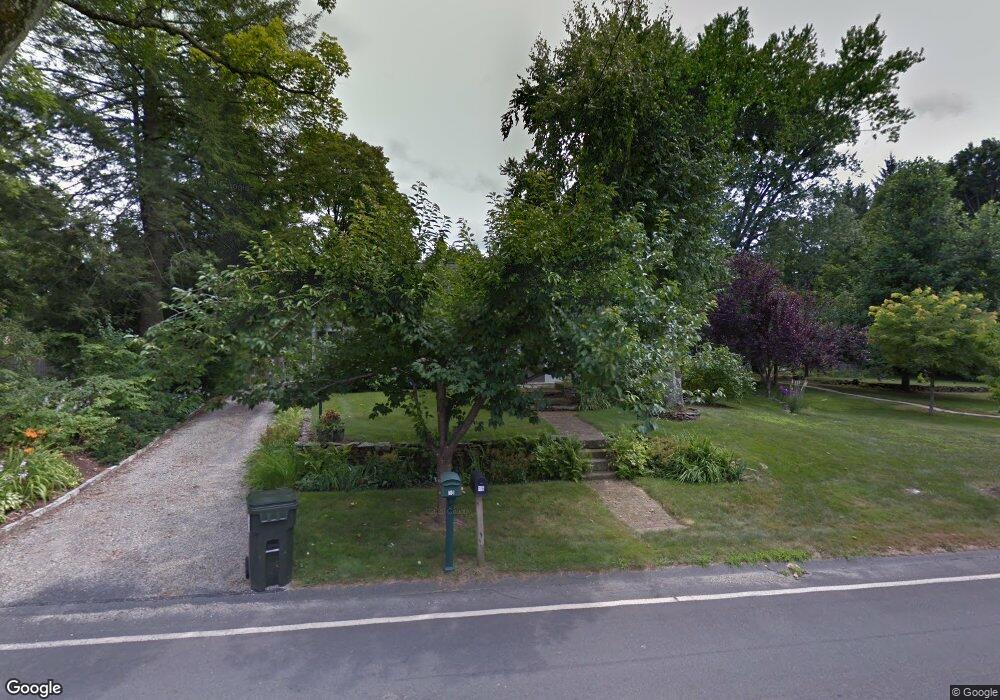
10 1/2 Springfield St Wilbraham, MA 01095
Estimated Value: $407,000 - $672,000
1
Bed
1
Bath
480
Sq Ft
$1,190/Sq Ft
Est. Value
About This Home
This home is located at 10 1/2 Springfield St, Wilbraham, MA 01095 and is currently estimated at $571,334, approximately $1,190 per square foot. 10 1/2 Springfield St is a home located in Hampden County with nearby schools including Minnechaug Regional High School, Springfield International Charter School, and Wilbraham & Monson Academy.
Ownership History
Date
Name
Owned For
Owner Type
Purchase Details
Closed on
Jul 10, 2015
Sold by
Barone Sharmaine
Bought by
Stimpson Marc L and Stimpson Melissa M
Current Estimated Value
Home Financials for this Owner
Home Financials are based on the most recent Mortgage that was taken out on this home.
Original Mortgage
$180,000
Outstanding Balance
$140,402
Interest Rate
3.87%
Mortgage Type
New Conventional
Estimated Equity
$430,932
Purchase Details
Closed on
Aug 8, 2014
Sold by
Orourke Michael L and Orourke Wendy A
Bought by
Barone Sharmaine
Purchase Details
Closed on
May 30, 1996
Sold by
Ghent Gail C
Bought by
Orourke Michael L and Orourke Wendy A
Home Financials for this Owner
Home Financials are based on the most recent Mortgage that was taken out on this home.
Original Mortgage
$95,000
Interest Rate
7.91%
Mortgage Type
Purchase Money Mortgage
Purchase Details
Closed on
Oct 12, 1995
Sold by
Zeo Jon A and Zeo Constance P
Bought by
Ghent Gail
Home Financials for this Owner
Home Financials are based on the most recent Mortgage that was taken out on this home.
Original Mortgage
$85,000
Interest Rate
7.71%
Mortgage Type
Purchase Money Mortgage
Create a Home Valuation Report for This Property
The Home Valuation Report is an in-depth analysis detailing your home's value as well as a comparison with similar homes in the area
Home Values in the Area
Average Home Value in this Area
Purchase History
| Date | Buyer | Sale Price | Title Company |
|---|---|---|---|
| Stimpson Marc L | $435,000 | -- | |
| Barone Sharmaine | $404,000 | -- | |
| Orourke Michael L | $165,000 | -- | |
| Ghent Gail | $185,000 | -- |
Source: Public Records
Mortgage History
| Date | Status | Borrower | Loan Amount |
|---|---|---|---|
| Open | Stimpson Marc L | $180,000 | |
| Previous Owner | Ghent Gail | $95,000 | |
| Previous Owner | Ghent Gail | $85,000 |
Source: Public Records
Tax History Compared to Growth
Tax History
| Year | Tax Paid | Tax Assessment Tax Assessment Total Assessment is a certain percentage of the fair market value that is determined by local assessors to be the total taxable value of land and additions on the property. | Land | Improvement |
|---|---|---|---|---|
| 2025 | $11,409 | $638,100 | $93,800 | $544,300 |
| 2024 | $10,989 | $594,000 | $93,800 | $500,200 |
| 2023 | $10,827 | $579,000 | $93,800 | $485,200 |
| 2022 | $11,466 | $559,600 | $93,800 | $465,800 |
| 2021 | $9,910 | $431,600 | $101,900 | $329,700 |
| 2020 | $9,659 | $431,600 | $101,900 | $329,700 |
| 2019 | $9,411 | $431,700 | $101,900 | $329,800 |
| 2018 | $9,599 | $424,000 | $101,900 | $322,100 |
| 2017 | $9,328 | $424,000 | $101,900 | $322,100 |
| 2016 | $8,394 | $388,600 | $108,400 | $280,200 |
| 2015 | -- | $388,600 | $108,400 | $280,200 |
Source: Public Records
Map
Nearby Homes
- 8 Patriot Ridge Ln
- 68 Monson Rd
- 2 Bayberry Dr Unit 51
- 6 Hilltop Park
- 28 Decorie Dr
- 12 Highridge Rd
- 474 Mountain Rd
- 751 Ridge Rd
- 760 Stony Hill Rd
- 767 Stony Hill Rd
- 763 Stony Hill Rd
- 14 Brookdale Dr
- 1028 Tinkham Rd
- 5 Edgewood Rd
- 474-480 Mountain Rd
- 69 High Pine Cir
- 17 Peak Rd
- 6 Katie St
- 407 Monson Rd
- 92 Sandalwood Dr
- 10 Springfield St
- 8 Springfield St
- 15 Springfield St
- 24 Springfield St
- 21 Springfield St
- 9 Springfield St
- 9 Springfield St Unit 1
- 6 Springfield St
- 25/27 Springfield St Unit 2
- 25 Springfield St Unit 27
- 4 Springfield St
- 5 Springfield St
- 31 Springfield St
- 11 Springfield St
- 2 Springfield St
- 473 Main St
- 473 Main St Unit 2
- 473 Main St Unit rear
- 477 Main St
- 481 Main St