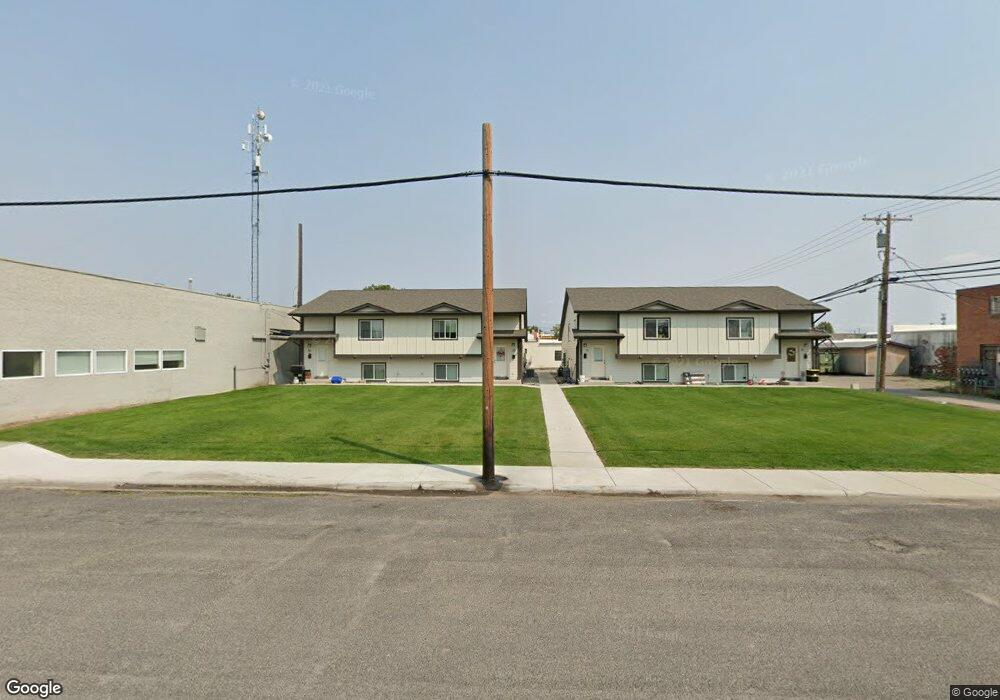
10 3rd Ave Laurel, MT 59044
Estimated Value: $896,642
Studio
--
Bath
2,544
Sq Ft
$352/Sq Ft
Est. Value
About This Home
This home is located at 10 3rd Ave, Laurel, MT 59044 and is currently estimated at $896,642, approximately $352 per square foot. 10 3rd Ave is a home located in Yellowstone County with nearby schools including Fred W. Graff School, West School, and Laurel Middle School.
Ownership History
Date
Name
Owned For
Owner Type
Purchase Details
Closed on
Feb 17, 2017
Sold by
Columbus Total Construction Llc
Bought by
Jw Roylance Construction Inc
Current Estimated Value
Purchase Details
Closed on
Jun 22, 2015
Sold by
Investment Properties Finance Group Llc
Bought by
Columbus Total Construction Llc
Purchase Details
Closed on
Aug 1, 2013
Sold by
County Treasurer Of The County Of Yellow
Bought by
Investment Properites Finance Group Llc
Create a Home Valuation Report for This Property
The Home Valuation Report is an in-depth analysis detailing your home's value as well as a comparison with similar homes in the area
Home Values in the Area
Average Home Value in this Area
Purchase History
| Date | Buyer | Sale Price | Title Company |
|---|---|---|---|
| Jw Roylance Construction Inc | -- | American Title & Escrow | |
| Columbus Total Construction Llc | -- | None Available | |
| Investment Properites Finance Group Llc | $3,112 | None Available |
Source: Public Records
Tax History
| Year | Tax Paid | Tax Assessment Tax Assessment Total Assessment is a certain percentage of the fair market value that is determined by local assessors to be the total taxable value of land and additions on the property. | Land | Improvement |
|---|---|---|---|---|
| 2025 | $8,011 | $985,900 | $93,894 | $892,006 |
| 2024 | $8,011 | $817,100 | $77,788 | $739,312 |
| 2023 | $7,388 | $817,100 | $77,788 | $739,312 |
| 2022 | $7,313 | $778,300 | $0 | $0 |
| 2021 | $7,376 | $778,300 | $0 | $0 |
| 2020 | $7,563 | $817,300 | $0 | $0 |
| 2019 | $7,596 | $817,300 | $0 | $0 |
| 2018 | $8,943 | $892,449 | $0 | $0 |
| 2017 | $1,735 | $84,329 | $0 | $0 |
| 2016 | $1,866 | $98,280 | $0 | $0 |
| 2015 | $2,042 | $114,560 | $0 | $0 |
| 2014 | $1,742 | $65,704 | $0 | $0 |
Source: Public Records
Map
Nearby Homes
- 116 4th Ave
- 319 6th Ave
- 211 Woodland Ave
- 110 E 5th St
- 120 Forrest Ave
- 603 5th Ave
- 102 8th Ave Unit B
- 208 West Ave
- 409 Maple Ave
- 310 (and 814 w 4) 8th Ave
- 516 Pennsylvania Ave
- 414 Wyoming Ave
- 419 Durland Ave
- 601 E 5th St
- 717 E 5th St
- 801 E 4th St
- 717 E 5th, 506 Alder Ave
- 1003 Montana Ave
- 1109 10th Ave
- 605 Date Ave
Your Personal Tour Guide
Ask me questions while you tour the home.