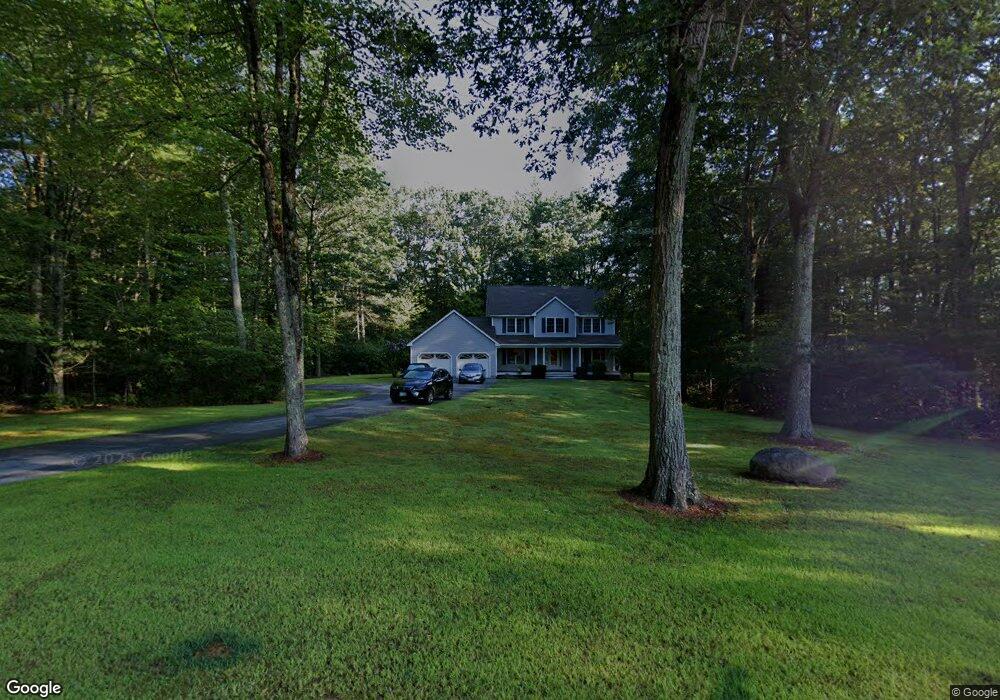
10 Abbey Rd Merrimack, NH 03054
Estimated Value: $749,787 - $906,000
4
Beds
3
Baths
2,511
Sq Ft
$320/Sq Ft
Est. Value
About This Home
This home is located at 10 Abbey Rd, Merrimack, NH 03054 and is currently estimated at $803,447, approximately $319 per square foot. 10 Abbey Rd is a home located in Hillsborough County with nearby schools including Thorntons Ferry School, Merrimack Middle School, and James Mastricola Upper Elementary School.
Ownership History
Date
Name
Owned For
Owner Type
Purchase Details
Closed on
May 2, 2011
Sold by
Gallagher James F and Gallagher Bethany S
Bought by
Fornarolo Michael B and Fornarolo Diane
Current Estimated Value
Home Financials for this Owner
Home Financials are based on the most recent Mortgage that was taken out on this home.
Original Mortgage
$277,200
Interest Rate
4.76%
Mortgage Type
Purchase Money Mortgage
Purchase Details
Closed on
Dec 13, 2006
Sold by
Holohan Mark
Bought by
Ras Bethany S
Create a Home Valuation Report for This Property
The Home Valuation Report is an in-depth analysis detailing your home's value as well as a comparison with similar homes in the area
Home Values in the Area
Average Home Value in this Area
Purchase History
Date | Buyer | Sale Price | Title Company |
---|---|---|---|
Fornarolo Michael B | $346,500 | -- | |
Ras Bethany S | $385,000 | -- |
Source: Public Records
Mortgage History
Date | Status | Borrower | Loan Amount |
---|---|---|---|
Open | Fornarolo Michael B | $225,500 | |
Closed | Ras Bethany S | $272,000 | |
Closed | Ras Bethany S | $277,200 | |
Previous Owner | Ras Bethany S | $270,400 | |
Previous Owner | Ras Bethany S | $25,000 |
Source: Public Records
Tax History Compared to Growth
Tax History
Year | Tax Paid | Tax Assessment Tax Assessment Total Assessment is a certain percentage of the fair market value that is determined by local assessors to be the total taxable value of land and additions on the property. | Land | Improvement |
---|---|---|---|---|
2024 | $10,680 | $516,200 | $246,600 | $269,600 |
2023 | $10,040 | $516,200 | $246,600 | $269,600 |
2022 | $8,972 | $516,200 | $246,600 | $269,600 |
2021 | $8,863 | $516,200 | $246,600 | $269,600 |
2020 | $9,297 | $386,400 | $174,600 | $211,800 |
2019 | $9,324 | $386,400 | $174,600 | $211,800 |
2018 | $8,941 | $370,700 | $174,600 | $196,100 |
2017 | $8,663 | $370,700 | $174,600 | $196,100 |
2016 | $8,448 | $370,700 | $174,600 | $196,100 |
2015 | $8,516 | $344,500 | $162,600 | $181,900 |
2014 | $8,299 | $344,500 | $162,600 | $181,900 |
2013 | $8,237 | $344,500 | $162,600 | $181,900 |
Source: Public Records
Map
Nearby Homes