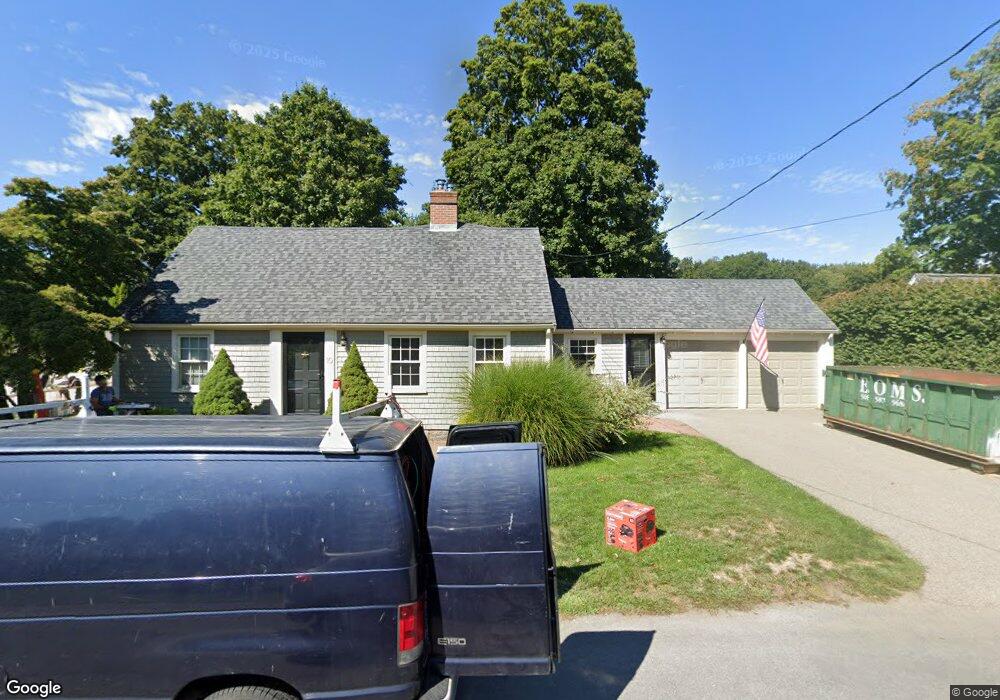
10 Aberdeen Rd Hingham, MA 02043
Estimated Value: $1,123,831 - $1,307,000
4
Beds
2
Baths
1,930
Sq Ft
$638/Sq Ft
Est. Value
About This Home
This home is located at 10 Aberdeen Rd, Hingham, MA 02043 and is currently estimated at $1,231,458, approximately $638 per square foot. 10 Aberdeen Rd is a home located in Plymouth County with nearby schools including East Elementary School, Hingham Middle School, and Hingham High School.
Ownership History
Date
Name
Owned For
Owner Type
Purchase Details
Closed on
Mar 12, 2010
Sold by
Thorell Rt and Thorell David L
Bought by
Thorell Mark D and Thorell Abby E
Current Estimated Value
Purchase Details
Closed on
Aug 15, 2005
Sold by
Hodgkins-Devito Susan
Bought by
Thorell Rt and Thorell David L
Purchase Details
Closed on
Aug 29, 1997
Sold by
Barrett Michael G and Barrett Marianne
Bought by
Field James and Hodgkins Susan
Purchase Details
Closed on
May 26, 1994
Sold by
Eddy Dorna M
Bought by
Barrett Michael G and Barrett Marianne
Create a Home Valuation Report for This Property
The Home Valuation Report is an in-depth analysis detailing your home's value as well as a comparison with similar homes in the area
Purchase History
| Date | Buyer | Sale Price | Title Company |
|---|---|---|---|
| Thorell Mark D | -- | -- | |
| Thorell Rt | $585,000 | -- | |
| Field James | $250,000 | -- | |
| Barrett Michael G | $202,600 | -- |
Source: Public Records
Mortgage History
| Date | Status | Borrower | Loan Amount |
|---|---|---|---|
| Open | Barrett Michael G | $318,000 | |
| Closed | Barrett Michael G | $30,000 |
Source: Public Records
Tax History
| Year | Tax Paid | Tax Assessment Tax Assessment Total Assessment is a certain percentage of the fair market value that is determined by local assessors to be the total taxable value of land and additions on the property. | Land | Improvement |
|---|---|---|---|---|
| 2025 | $10,191 | $953,300 | $524,300 | $429,000 |
| 2024 | $9,840 | $906,900 | $524,300 | $382,600 |
| 2023 | $8,564 | $856,400 | $524,300 | $332,100 |
| 2022 | $8,652 | $748,400 | $473,300 | $275,100 |
| 2021 | $8,340 | $706,800 | $455,100 | $251,700 |
| 2020 | $8,149 | $706,800 | $455,100 | $251,700 |
| 2019 | $8,173 | $685,600 | $455,100 | $230,500 |
| 2018 | $8,019 | $681,300 | $455,100 | $226,200 |
| 2017 | $8,136 | $664,200 | $447,900 | $216,300 |
| 2016 | $8,030 | $642,900 | $426,600 | $216,300 |
| 2015 | $7,899 | $630,400 | $406,300 | $224,100 |
Source: Public Records
Map
Nearby Homes
Your Personal Tour Guide
Ask me questions while you tour the home.