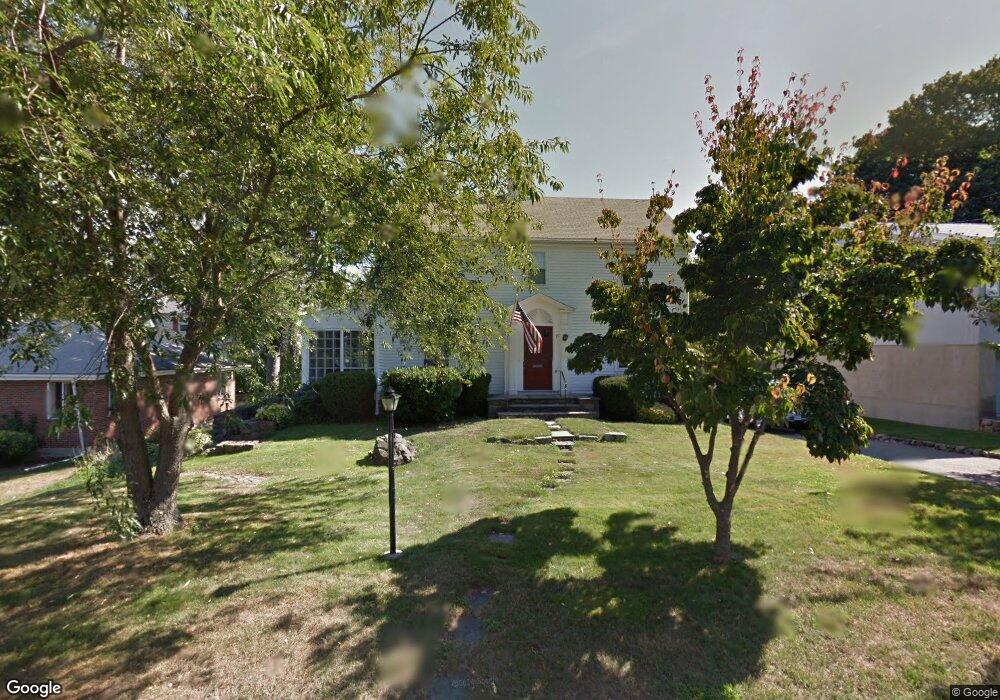
10 Adams Rd Marblehead, MA 01945
Estimated Value: $1,246,346 - $1,615,000
4
Beds
2
Baths
2,424
Sq Ft
$606/Sq Ft
Est. Value
About This Home
This home is located at 10 Adams Rd, Marblehead, MA 01945 and is currently estimated at $1,469,587, approximately $606 per square foot. 10 Adams Rd is a home located in Essex County with nearby schools including Marblehead High School, Devereux School, and Tower School.
Ownership History
Date
Name
Owned For
Owner Type
Purchase Details
Closed on
Mar 27, 2024
Sold by
Butler Brian and Butler Stacey
Bought by
Butler Ft and Butler
Current Estimated Value
Purchase Details
Closed on
Aug 18, 2017
Sold by
Butler Brian
Bought by
Butler Brian and Butler Stacey
Home Financials for this Owner
Home Financials are based on the most recent Mortgage that was taken out on this home.
Original Mortgage
$667,000
Interest Rate
3.89%
Purchase Details
Closed on
Sep 26, 2012
Sold by
Barbour Diane L and Butler Robert J
Bought by
Butler Brian
Home Financials for this Owner
Home Financials are based on the most recent Mortgage that was taken out on this home.
Original Mortgage
$417,000
Interest Rate
3.62%
Mortgage Type
New Conventional
Purchase Details
Closed on
Jan 14, 2010
Sold by
10 Adams Road T and Butler
Bought by
Barbour Diane L
Create a Home Valuation Report for This Property
The Home Valuation Report is an in-depth analysis detailing your home's value as well as a comparison with similar homes in the area
Home Values in the Area
Average Home Value in this Area
Purchase History
| Date | Buyer | Sale Price | Title Company |
|---|---|---|---|
| Butler Ft | -- | None Available | |
| Butler Brian | -- | -- | |
| Butler Brian | $540,000 | -- | |
| Barbour Diane L | -- | -- |
Source: Public Records
Mortgage History
| Date | Status | Borrower | Loan Amount |
|---|---|---|---|
| Previous Owner | Barbour Diane L | $667,000 | |
| Previous Owner | Barbour Diane L | $417,000 |
Source: Public Records
Tax History
| Year | Tax Paid | Tax Assessment Tax Assessment Total Assessment is a certain percentage of the fair market value that is determined by local assessors to be the total taxable value of land and additions on the property. | Land | Improvement |
|---|---|---|---|---|
| 2025 | $11,397 | $1,259,300 | $881,800 | $377,500 |
| 2024 | $12,297 | $1,372,400 | $1,007,700 | $364,700 |
| 2023 | $11,104 | $1,110,400 | $818,800 | $291,600 |
| 2022 | $9,891 | $940,200 | $655,000 | $285,200 |
| 2021 | $9,752 | $935,900 | $655,000 | $280,900 |
| 2020 | $8,531 | $821,100 | $554,200 | $266,900 |
| 2019 | $8,435 | $785,400 | $529,100 | $256,300 |
| 2018 | $7,658 | $694,900 | $478,700 | $216,200 |
| 2017 | $7,235 | $657,100 | $440,900 | $216,200 |
| 2016 | $6,744 | $607,600 | $428,300 | $179,300 |
| 2015 | $6,732 | $607,600 | $428,300 | $179,300 |
| 2014 | $6,633 | $598,100 | $428,300 | $169,800 |
Source: Public Records
Map
Nearby Homes
- 282 Pleasant St
- 23 Wyman Rd
- 34 Lafayette St
- 4 Dean Rd
- 33 W Shore Dr
- 16 Pickwick Rd
- 12 Pickwick Rd
- 7 Cottage St
- 30 Haley Rd Unit 1
- 41 Atlantic Ave Unit 3
- 41 Atlantic Ave Unit 1
- 290 Washington St Unit A
- 10 Redstone Ln
- 55 Brackett Place Unit B
- 11 Elbridge Ln Unit 11
- 6 Mount Vernon St
- 8 Linden St
- 212 Humphrey St Unit 205
- 197A W Shore Dr Unit A
- 11 Angenica Terrace
Your Personal Tour Guide
Ask me questions while you tour the home.