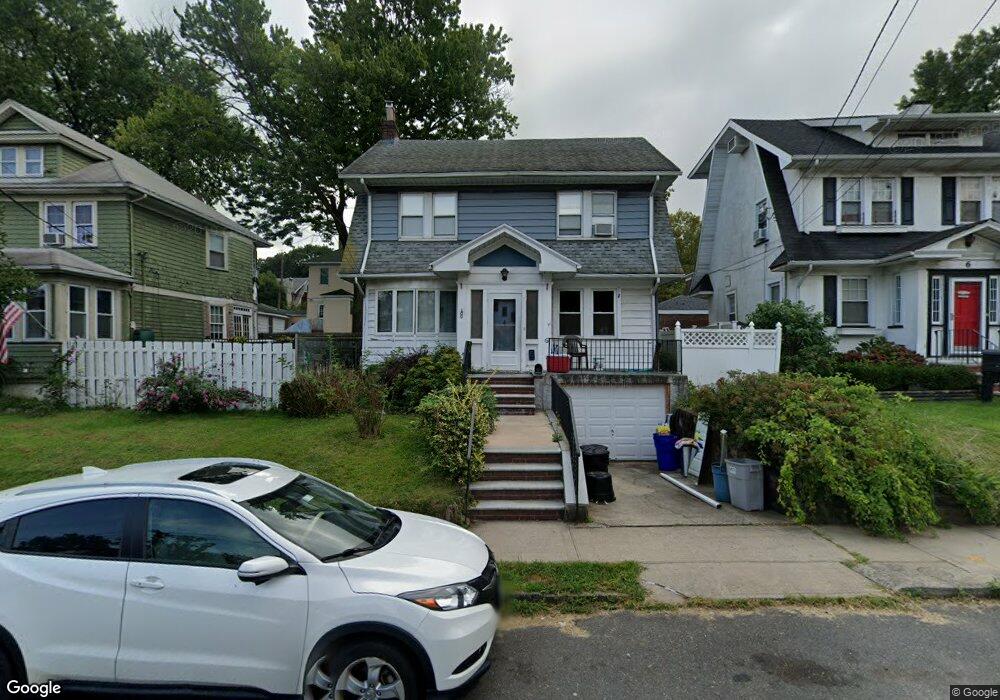
10 Allen Ct Staten Island, NY 10310
West Brighton NeighborhoodEstimated Value: $633,528 - $831,000
--
Bed
4
Baths
1,160
Sq Ft
$611/Sq Ft
Est. Value
About This Home
This home is located at 10 Allen Ct, Staten Island, NY 10310 and is currently estimated at $708,382, approximately $610 per square foot. 10 Allen Ct is a home located in Richmond County with nearby schools including P.S. 45 John Tyler, Intermediate School 27, and Curtis High School.
Ownership History
Date
Name
Owned For
Owner Type
Purchase Details
Closed on
Jan 25, 2019
Sold by
Keag Kathleen T and Keag Christopher D
Bought by
Slyman Thomas J and Slyman Meghan E
Current Estimated Value
Home Financials for this Owner
Home Financials are based on the most recent Mortgage that was taken out on this home.
Original Mortgage
$4,000,000
Outstanding Balance
$3,516,716
Interest Rate
4.5%
Mortgage Type
New Conventional
Estimated Equity
-$2,808,334
Purchase Details
Closed on
Mar 13, 1996
Sold by
Ditolla Eileen and Eckett Anna
Bought by
Keag Brendan F
Create a Home Valuation Report for This Property
The Home Valuation Report is an in-depth analysis detailing your home's value as well as a comparison with similar homes in the area
Home Values in the Area
Average Home Value in this Area
Purchase History
| Date | Buyer | Sale Price | Title Company |
|---|---|---|---|
| Slyman Thomas J | $500,000 | Fidelity National Title Ins | |
| Keag Brendan F | $160,000 | -- |
Source: Public Records
Mortgage History
| Date | Status | Borrower | Loan Amount |
|---|---|---|---|
| Open | Slyman Thomas J | $4,000,000 |
Source: Public Records
Tax History Compared to Growth
Tax History
| Year | Tax Paid | Tax Assessment Tax Assessment Total Assessment is a certain percentage of the fair market value that is determined by local assessors to be the total taxable value of land and additions on the property. | Land | Improvement |
|---|---|---|---|---|
| 2025 | $6,081 | $38,580 | $8,459 | $30,121 |
| 2024 | $6,081 | $36,840 | $8,481 | $28,359 |
| 2023 | $6,013 | $29,608 | $7,083 | $22,525 |
| 2022 | $5,576 | $35,100 | $10,320 | $24,780 |
| 2021 | $5,546 | $31,740 | $10,320 | $21,420 |
| 2020 | $6,438 | $27,360 | $10,320 | $17,040 |
| 2019 | $6,998 | $28,740 | $10,320 | $18,420 |
| 2018 | $1,856 | $24,673 | $9,327 | $15,346 |
| 2017 | $1,726 | $23,277 | $8,591 | $14,686 |
| 2016 | $1,574 | $21,960 | $6,892 | $15,068 |
| 2015 | $1,408 | $21,960 | $6,724 | $15,236 |
| 2014 | $1,408 | $21,025 | $7,689 | $13,336 |
Source: Public Records
Map
Nearby Homes