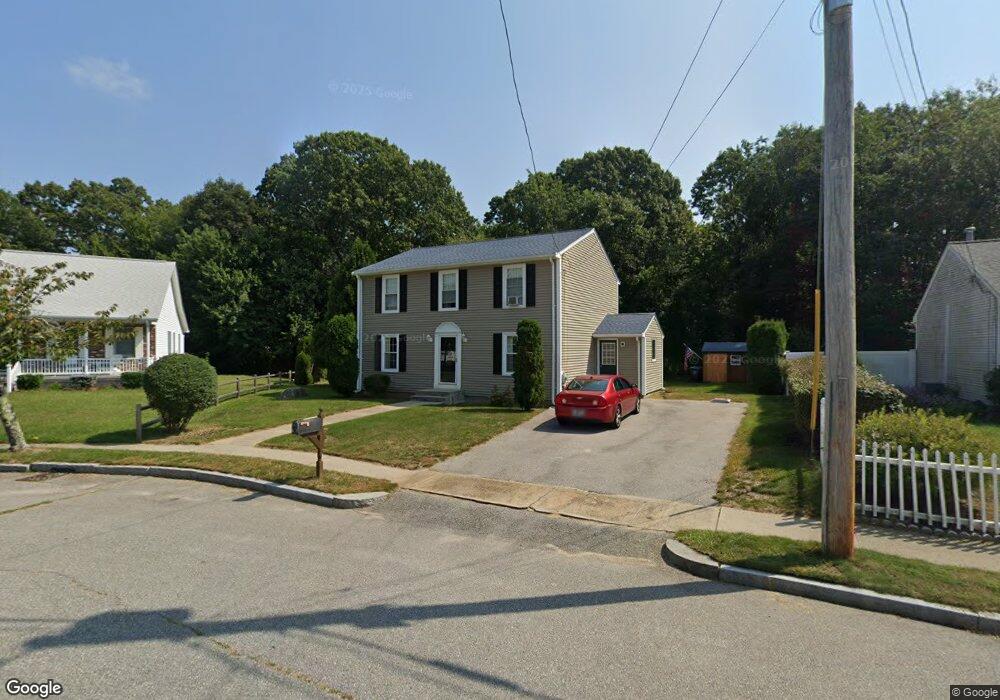
10 Allison Ct Riverside, RI 02915
Riverside NeighborhoodEstimated Value: $447,000 - $506,697
3
Beds
2
Baths
1,664
Sq Ft
$286/Sq Ft
Est. Value
About This Home
This home is located at 10 Allison Ct, Riverside, RI 02915 and is currently estimated at $476,174, approximately $286 per square foot. 10 Allison Ct is a home located in Providence County with nearby schools including East Providence High School, St Luke Elementary School, and Barrington Christian Academy.
Ownership History
Date
Name
Owned For
Owner Type
Purchase Details
Closed on
Sep 30, 1994
Sold by
Winquist Carl A
Bought by
Odonnell Charles A and Odonnell Pamela
Current Estimated Value
Create a Home Valuation Report for This Property
The Home Valuation Report is an in-depth analysis detailing your home's value as well as a comparison with similar homes in the area
Home Values in the Area
Average Home Value in this Area
Purchase History
| Date | Buyer | Sale Price | Title Company |
|---|---|---|---|
| Odonnell Charles A | $137,000 | -- |
Source: Public Records
Mortgage History
| Date | Status | Borrower | Loan Amount |
|---|---|---|---|
| Open | Odonnell Charles A | $50,000 | |
| Closed | Odonnell Charles A | $137,500 | |
| Closed | Odonnell Charles A | $30,000 | |
| Closed | Odonnell Charles A | $126,000 |
Source: Public Records
Tax History
| Year | Tax Paid | Tax Assessment Tax Assessment Total Assessment is a certain percentage of the fair market value that is determined by local assessors to be the total taxable value of land and additions on the property. | Land | Improvement |
|---|---|---|---|---|
| 2025 | $6,147 | $470,300 | $138,900 | $331,400 |
| 2024 | $6,019 | $392,600 | $115,700 | $276,900 |
| 2023 | $5,795 | $392,600 | $115,700 | $276,900 |
| 2022 | $6,433 | $294,300 | $58,800 | $235,500 |
| 2021 | $6,327 | $294,300 | $58,800 | $235,500 |
| 2020 | $6,060 | $294,300 | $58,800 | $235,500 |
| 2019 | $5,892 | $294,300 | $58,800 | $235,500 |
| 2018 | $5,860 | $256,100 | $57,200 | $198,900 |
| 2017 | $5,729 | $256,100 | $57,200 | $198,900 |
| 2016 | $5,701 | $256,100 | $57,200 | $198,900 |
| 2015 | $5,891 | $256,700 | $53,000 | $203,700 |
| 2014 | $5,891 | $256,700 | $53,000 | $203,700 |
Source: Public Records
Map
Nearby Homes
- 85 Hilton Ave
- 99 Palmer Ave
- 236 Becker Ave
- 14 Winthrop St
- 22 Grassy Plain Rd
- 15 Claire St
- 63 Cul de Sac Way
- 6 Hazelton Rd
- 47 Dartmouth Ave
- 79 Sherman St
- 38 Meadowcrest Dr
- 11 Elton Rd
- 0 Carousel Dr
- 85 Hospital Rd
- 168 Washington Rd
- 0 Pinetop Rd
- 20 Townsend St
- 25 Arnold St
- 1741 Wampanoag Trail
- 56 Knowlton St
Your Personal Tour Guide
Ask me questions while you tour the home.