Estimated Value: $316,246 - $342,000
4
Beds
3
Baths
2,040
Sq Ft
$161/Sq Ft
Est. Value
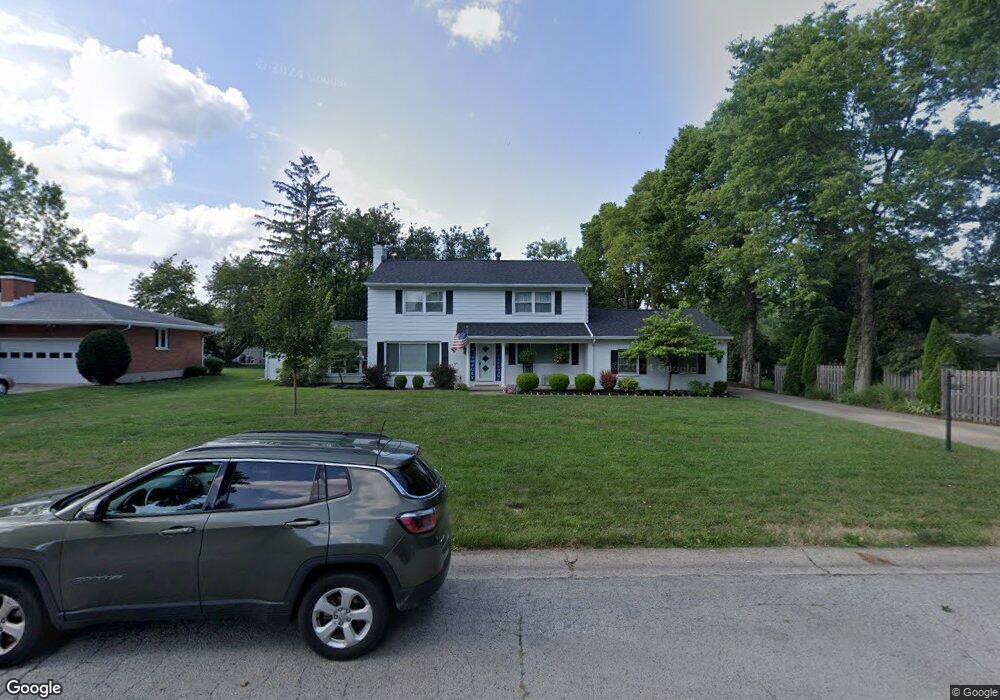
About This Home
This home is located at 10 Alpha Dr, Piqua, OH 45356 and is currently estimated at $328,062, approximately $160 per square foot. 10 Alpha Dr is a home located in Miami County with nearby schools including Washington Primary School, Piqua Junior High School, and Piqua High School.
Ownership History
Date
Name
Owned For
Owner Type
Purchase Details
Closed on
Feb 27, 2014
Sold by
Young John A and Young Amy J
Bought by
Mikolajewski Samuel D and Mikolajewski Kara
Current Estimated Value
Home Financials for this Owner
Home Financials are based on the most recent Mortgage that was taken out on this home.
Original Mortgage
$156,750
Outstanding Balance
$116,926
Interest Rate
4.39%
Mortgage Type
New Conventional
Estimated Equity
$211,136
Purchase Details
Closed on
May 25, 2005
Sold by
Klepinger Christopher L and Klepinger Mary E
Bought by
Young John A and Young Amy J
Purchase Details
Closed on
Jun 2, 1999
Sold by
Vollette Cheryl E
Bought by
Klepinger Christopher L and Klepinger Mary E
Home Financials for this Owner
Home Financials are based on the most recent Mortgage that was taken out on this home.
Original Mortgage
$80,000
Interest Rate
6.94%
Mortgage Type
New Conventional
Purchase Details
Closed on
Apr 25, 1994
Bought by
Vollette Cheryl E
Create a Home Valuation Report for This Property
The Home Valuation Report is an in-depth analysis detailing your home's value as well as a comparison with similar homes in the area
Home Values in the Area
Average Home Value in this Area
Purchase History
| Date | Buyer | Sale Price | Title Company |
|---|---|---|---|
| Mikolajewski Samuel D | $165,000 | Springdale Title Llc | |
| Young John A | $185,000 | -- | |
| Klepinger Christopher L | $132,500 | -- | |
| Vollette Cheryl E | -- | -- |
Source: Public Records
Mortgage History
| Date | Status | Borrower | Loan Amount |
|---|---|---|---|
| Open | Mikolajewski Samuel D | $156,750 | |
| Previous Owner | Klepinger Christopher L | $80,000 | |
| Closed | Klepinger Christopher L | $0 |
Source: Public Records
Tax History
| Year | Tax Paid | Tax Assessment Tax Assessment Total Assessment is a certain percentage of the fair market value that is determined by local assessors to be the total taxable value of land and additions on the property. | Land | Improvement |
|---|---|---|---|---|
| 2025 | $2,715 | $76,860 | $14,490 | $62,370 |
| 2024 | $2,715 | $74,870 | $14,460 | $60,410 |
| 2023 | $3,079 | $74,870 | $14,460 | $60,410 |
| 2022 | $3,133 | $74,870 | $14,460 | $60,410 |
| 2021 | $2,853 | $62,370 | $12,040 | $50,330 |
| 2020 | $2,796 | $62,370 | $12,040 | $50,330 |
| 2019 | $2,812 | $62,370 | $12,040 | $50,330 |
| 2018 | $2,670 | $56,530 | $12,040 | $44,490 |
| 2017 | $2,703 | $56,530 | $12,040 | $44,490 |
| 2016 | $2,673 | $56,530 | $12,040 | $44,490 |
| 2015 | $2,735 | $56,530 | $12,040 | $44,490 |
| 2014 | $2,735 | $56,530 | $12,040 | $44,490 |
| 2013 | $3,311 | $68,220 | $12,040 | $56,180 |
Source: Public Records
Map
Nearby Homes
- 2 Orchard Dr
- 507 N Parkway Dr
- 1712 Park Ave
- 103 Lakewood Place
- 1102 Fountain Blvd
- 315 N Sunset Dr
- 8460 N Bennett Dr
- 8460 Bennett Dr Unit C
- 802 Washington Ave
- 1839 Wilshire Dr
- 1515 W High St
- 1414 Washington Ave
- 1062 Boone St
- 1115 Madison Ave
- 800 Antler Ct
- 1040 Camp St
- 413 Deerwood Dr
- 618 Cherry St
- 723 Vine St
- 614 Cherry St
Your Personal Tour Guide
Ask me questions while you tour the home.