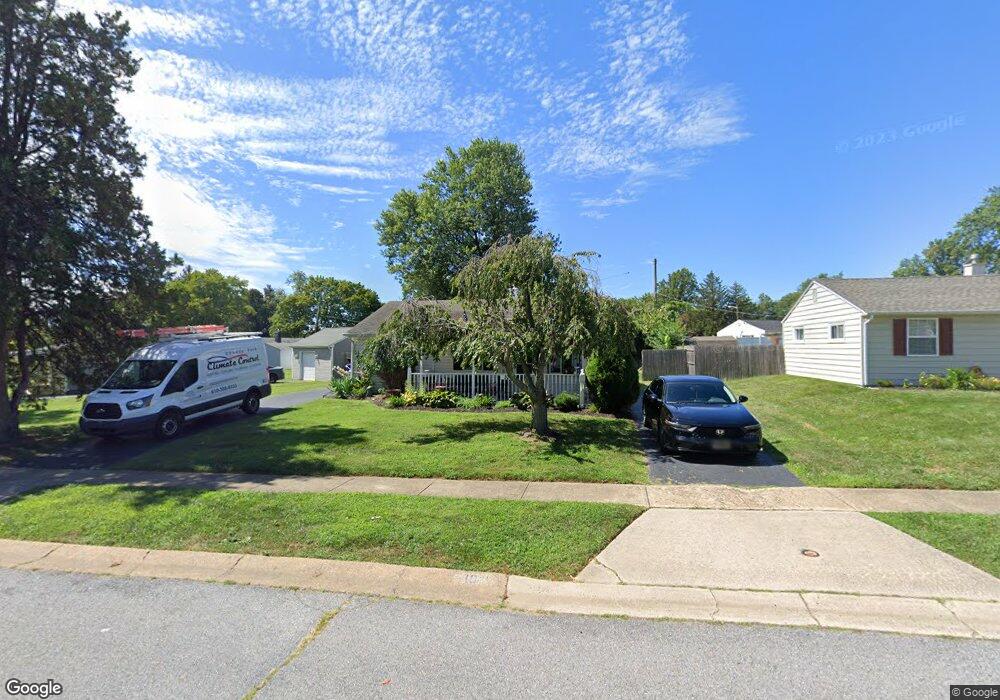
10 Angola Rd New Castle, DE 19720
Estimated Value: $239,000 - $286,000
3
Beds
1
Bath
1,161
Sq Ft
$229/Sq Ft
Est. Value
About This Home
This home is located at 10 Angola Rd, New Castle, DE 19720 and is currently estimated at $266,105, approximately $229 per square foot. 10 Angola Rd is a home located in New Castle County with nearby schools including Castle Hills Elementary School, Calvin R. McCullough Middle School, and Charter School of New Castle.
Ownership History
Date
Name
Owned For
Owner Type
Purchase Details
Closed on
Jun 9, 2006
Sold by
Fletcher Gigi
Bought by
Strab Francis J
Current Estimated Value
Home Financials for this Owner
Home Financials are based on the most recent Mortgage that was taken out on this home.
Original Mortgage
$166,900
Outstanding Balance
$98,398
Interest Rate
6.62%
Mortgage Type
Unknown
Estimated Equity
$167,707
Create a Home Valuation Report for This Property
The Home Valuation Report is an in-depth analysis detailing your home's value as well as a comparison with similar homes in the area
Home Values in the Area
Average Home Value in this Area
Purchase History
| Date | Buyer | Sale Price | Title Company |
|---|---|---|---|
| Strab Francis J | $166,900 | None Available |
Source: Public Records
Mortgage History
| Date | Status | Borrower | Loan Amount |
|---|---|---|---|
| Open | Strab Francis J | $166,900 |
Source: Public Records
Tax History Compared to Growth
Tax History
| Year | Tax Paid | Tax Assessment Tax Assessment Total Assessment is a certain percentage of the fair market value that is determined by local assessors to be the total taxable value of land and additions on the property. | Land | Improvement |
|---|---|---|---|---|
| 2024 | $1,243 | $36,200 | $6,500 | $29,700 |
| 2023 | $1,130 | $36,200 | $6,500 | $29,700 |
| 2022 | $1,177 | $36,200 | $6,500 | $29,700 |
| 2021 | $1,177 | $36,200 | $6,500 | $29,700 |
| 2020 | $1,184 | $36,200 | $6,500 | $29,700 |
| 2019 | $1,669 | $36,200 | $6,500 | $29,700 |
| 2018 | $1,160 | $36,200 | $6,500 | $29,700 |
| 2017 | $1,085 | $36,200 | $6,500 | $29,700 |
| 2016 | $971 | $36,200 | $6,500 | $29,700 |
| 2015 | $971 | $36,200 | $6,500 | $29,700 |
| 2014 | $972 | $36,200 | $6,500 | $29,700 |
Source: Public Records
Map
Nearby Homes