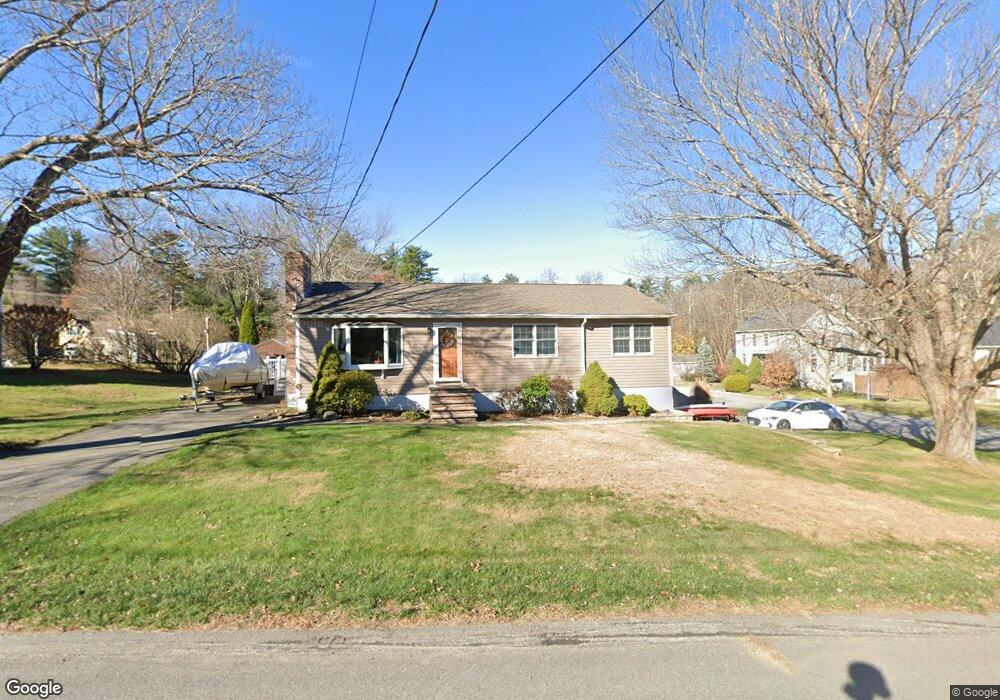
10 Appledore Ave Exeter, NH 03833
Estimated Value: $478,000 - $571,000
3
Beds
2
Baths
1,170
Sq Ft
$453/Sq Ft
Est. Value
About This Home
This home is located at 10 Appledore Ave, Exeter, NH 03833 and is currently estimated at $529,823, approximately $452 per square foot. 10 Appledore Ave is a home located in Rockingham County with nearby schools including Main Street School, Lincoln Street Elementary School, and Cooperative Middle School.
Ownership History
Date
Name
Owned For
Owner Type
Purchase Details
Closed on
Jun 28, 1999
Sold by
Esty Gilbert L and Esty Shirley S
Bought by
Yazinka David H and Yazinka Kathleen D
Current Estimated Value
Home Financials for this Owner
Home Financials are based on the most recent Mortgage that was taken out on this home.
Original Mortgage
$55,000
Interest Rate
7.09%
Create a Home Valuation Report for This Property
The Home Valuation Report is an in-depth analysis detailing your home's value as well as a comparison with similar homes in the area
Home Values in the Area
Average Home Value in this Area
Purchase History
| Date | Buyer | Sale Price | Title Company |
|---|---|---|---|
| Yazinka David H | $145,000 | -- |
Source: Public Records
Mortgage History
| Date | Status | Borrower | Loan Amount |
|---|---|---|---|
| Open | Yazinka David H | $85,500 | |
| Closed | Yazinka David H | $52,000 | |
| Closed | Yazinka David H | $48,000 | |
| Closed | Yazinka David H | $55,000 |
Source: Public Records
Tax History
| Year | Tax Paid | Tax Assessment Tax Assessment Total Assessment is a certain percentage of the fair market value that is determined by local assessors to be the total taxable value of land and additions on the property. | Land | Improvement |
|---|---|---|---|---|
| 2025 | $8,922 | $475,600 | $250,000 | $225,600 |
| 2024 | $8,461 | $475,600 | $250,000 | $225,600 |
| 2023 | $8,369 | $312,500 | $147,100 | $165,400 |
| 2022 | $7,734 | $312,500 | $147,100 | $165,400 |
| 2021 | $7,498 | $312,300 | $147,100 | $165,200 |
| 2020 | $7,648 | $312,300 | $147,100 | $165,200 |
| 2019 | $7,267 | $312,300 | $147,100 | $165,200 |
| 2018 | $6,617 | $240,600 | $95,400 | $145,200 |
| 2017 | $12,021 | $240,600 | $95,400 | $145,200 |
| 2016 | $11,865 | $240,600 | $95,400 | $145,200 |
| 2015 | $6,145 | $240,600 | $95,400 | $145,200 |
| 2014 | $5,877 | $225,500 | $104,900 | $120,600 |
| 2013 | $5,870 | $225,500 | $104,900 | $120,600 |
| 2011 | $5,701 | $225,500 | $104,900 | $120,600 |
Source: Public Records
Map
Nearby Homes
- 5 Bayberry Ln
- 3 Wheelwright Ave
- 0 High St Unit 2
- 24 Hampton Falls Rd
- 5 Wayside Dr
- 15 Prentiss Way
- 113 Crawley Falls Rd Unit 3
- 105 Portsmouth Ave Unit 9
- 51 Portsmouth Ave
- 5 Sterling Hill Ln Unit 514
- 101 Robinhood Dr
- 801 Nottingham Dr
- 31 Pinewood Dr
- 19 1st St
- 2 Haven Ln
- 10 String Bridge
- 13 Bell Ave
- 10 Maple St
- 163 Water St Unit B2
- 163 Water St Unit A1
Your Personal Tour Guide
Ask me questions while you tour the home.