10 Atherton Ln Sharon, MA 02067
Estimated Value: $1,156,000 - $1,270,000
4
Beds
4
Baths
3,100
Sq Ft
$390/Sq Ft
Est. Value
About This Home
This home is located at 10 Atherton Ln, Sharon, MA 02067 and is currently estimated at $1,208,324, approximately $389 per square foot. 10 Atherton Ln is a home located in Norfolk County with nearby schools including Heights Elementary School, Sharon Middle School, and Sharon High School.
Ownership History
Date
Name
Owned For
Owner Type
Purchase Details
Closed on
Aug 28, 2008
Sold by
Denerstein Richard and Denerstein Sheila R
Bought by
Yu Biao and Zou Yu
Current Estimated Value
Purchase Details
Closed on
Apr 29, 1994
Sold by
Nazier Navet Da and Nazer Samra N
Bought by
Denerstein Richard and Denerstein Sheial R
Purchase Details
Closed on
Sep 23, 1991
Sold by
Ma Ltd Land Corp
Bought by
Nizir Naveed A and Nazir Samra N
Create a Home Valuation Report for This Property
The Home Valuation Report is an in-depth analysis detailing your home's value as well as a comparison with similar homes in the area
Home Values in the Area
Average Home Value in this Area
Purchase History
| Date | Buyer | Sale Price | Title Company |
|---|---|---|---|
| Yu Biao | $538,000 | -- | |
| Denerstein Richard | $269,500 | -- | |
| Nizir Naveed A | $251,840 | -- |
Source: Public Records
Mortgage History
| Date | Status | Borrower | Loan Amount |
|---|---|---|---|
| Open | Nizir Naveed A | $400,000 | |
| Closed | Nizir Naveed A | $408,000 |
Source: Public Records
Tax History Compared to Growth
Tax History
| Year | Tax Paid | Tax Assessment Tax Assessment Total Assessment is a certain percentage of the fair market value that is determined by local assessors to be the total taxable value of land and additions on the property. | Land | Improvement |
|---|---|---|---|---|
| 2025 | $16,616 | $950,600 | $469,400 | $481,200 |
| 2024 | $15,959 | $907,800 | $430,600 | $477,200 |
| 2023 | $15,208 | $818,100 | $402,500 | $415,600 |
| 2022 | $14,892 | $754,000 | $335,400 | $418,600 |
| 2021 | $14,773 | $723,100 | $316,500 | $406,600 |
| 2020 | $13,739 | $723,100 | $316,500 | $406,600 |
| 2019 | $13,771 | $709,500 | $302,900 | $406,600 |
| 2018 | $13,627 | $703,500 | $296,900 | $406,600 |
| 2017 | $13,420 | $684,000 | $277,400 | $406,600 |
| 2016 | $13,031 | $648,000 | $277,400 | $370,600 |
| 2015 | $12,722 | $626,700 | $269,800 | $356,900 |
| 2014 | $11,783 | $573,400 | $245,300 | $328,100 |
Source: Public Records
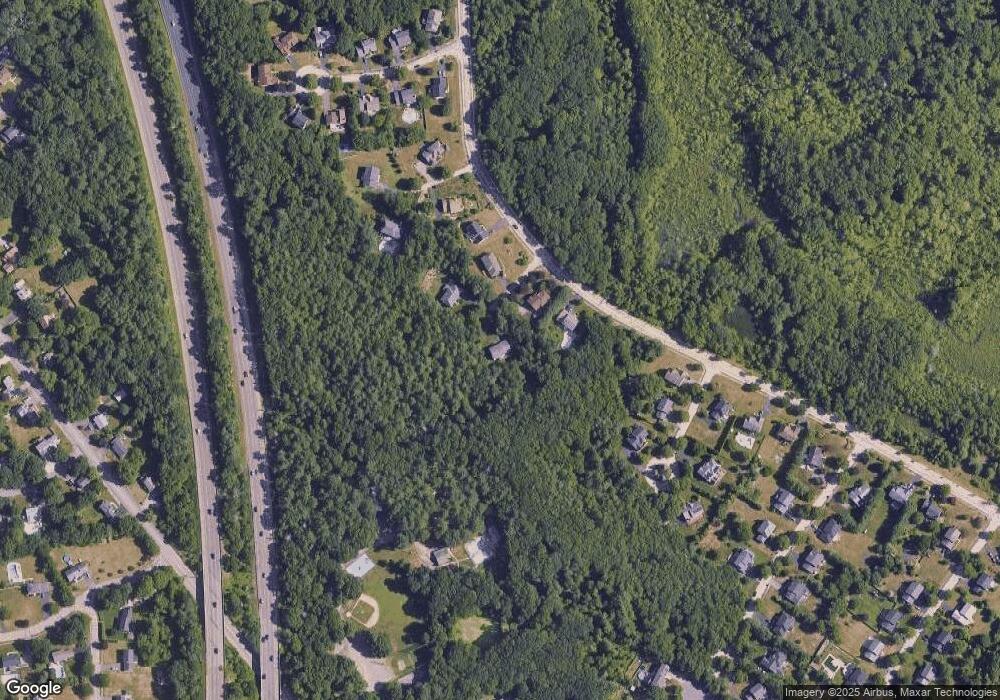
Map
Nearby Homes
- 89 Oak St
- 668 S Main St
- 186 Mechanic St
- 1 Roseland St Unit A-1
- 630 S Main St
- 91 Old Post Rd
- 97 Old Post Rd
- Lot One Old Wolomolopoag St
- Lot Two Old Wolomolopoag St
- 180 Old Post Rd Unit 202
- 180 Old Post Rd Unit 206
- 180 Old Post Rd Unit 201
- 180 Old Post Rd Unit 207
- 1 Eisenhauer Ln
- 170 Cannon Forge Dr
- 73 Ridge Rd
- 132 Cannon Forge Dr
- 2 Thompson Rd
- 35 Shoreline Dr
- 9 Independence Dr Unit 9