Estimated Value: $154,901 - $207,000
--
Bed
2
Baths
1,170
Sq Ft
$163/Sq Ft
Est. Value
About This Home
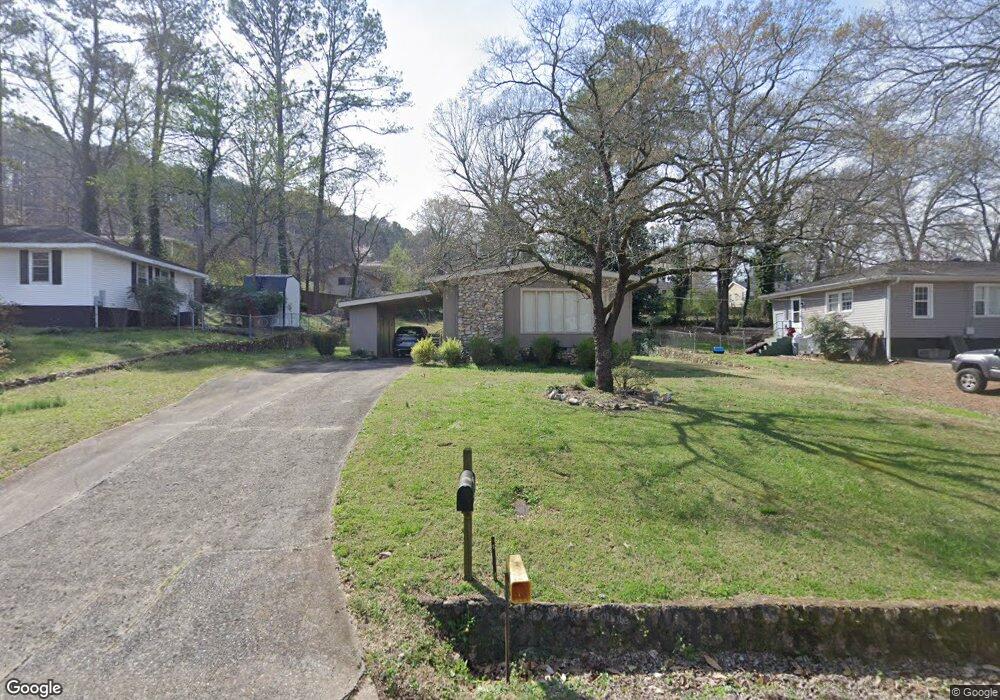
This home is located at 10 Azalea St SE, Rome, GA 30161 and is currently estimated at $190,975, approximately $163 per square foot. 10 Azalea St SE is a home located in Floyd County with nearby schools including Pepperell Middle School, Pepperell High School, and Montessori School of Rome.
Ownership History
Date
Name
Owned For
Owner Type
Purchase Details
Closed on
Oct 2, 2019
Sold by
Neighbors Calvin L Estate
Bought by
Neighbors Edith Marie
Current Estimated Value
Purchase Details
Closed on
Sep 15, 1975
Sold by
Watson Dewey V and Charlene Watson Dewey V
Bought by
Neighbors Calvin L Neighbors Calvin
Purchase Details
Closed on
Sep 17, 1971
Sold by
Griffies Wyatt R Griffies Wyatt R Griff
Bought by
Watson Dewey V and Decharlene Watson
Purchase Details
Closed on
Jun 15, 1971
Sold by
Mclemore Bobby E Mclemore Bobby E Mclem
Bought by
Griffies Wyatt R Griffies Wyatt R G
Purchase Details
Closed on
Apr 29, 1965
Sold by
Federal Housing Comm Federal Housing Com
Bought by
Mclemore Bobby E Mclemore Bobby E M
Purchase Details
Closed on
May 21, 1963
Sold by
Ada Paybe T and Ada Paybe T S
Bought by
Federal Housing Comm Federal Housing Com
Purchase Details
Closed on
Dec 1, 1961
Bought by
Ada Paybe T and Ada Paybe T S
Create a Home Valuation Report for This Property
The Home Valuation Report is an in-depth analysis detailing your home's value as well as a comparison with similar homes in the area
Home Values in the Area
Average Home Value in this Area
Purchase History
| Date | Buyer | Sale Price | Title Company |
|---|---|---|---|
| Neighbors Edith Marie | -- | -- | |
| Neighbors Calvin L Neighbors Calvin | $15,500 | -- | |
| Watson Dewey V | $1,000 | -- | |
| Griffies Wyatt R Griffies Wyatt R G | $17,000 | -- | |
| Mclemore Bobby E Mclemore Bobby E M | $11,000 | -- | |
| Federal Housing Comm Federal Housing Com | $12,100 | -- | |
| Ada Paybe T | -- | -- |
Source: Public Records
Tax History Compared to Growth
Tax History
| Year | Tax Paid | Tax Assessment Tax Assessment Total Assessment is a certain percentage of the fair market value that is determined by local assessors to be the total taxable value of land and additions on the property. | Land | Improvement |
|---|---|---|---|---|
| 2024 | $625 | $55,002 | $8,640 | $46,362 |
| 2023 | $565 | $52,176 | $7,680 | $44,496 |
| 2022 | $431 | $43,330 | $6,400 | $36,930 |
| 2021 | $376 | $35,544 | $6,400 | $29,144 |
| 2020 | $380 | $32,274 | $4,800 | $27,474 |
| 2019 | $299 | $27,045 | $4,800 | $22,245 |
| 2018 | $286 | $25,631 | $4,800 | $20,831 |
| 2017 | $276 | $24,773 | $4,800 | $19,973 |
| 2016 | $291 | $25,768 | $4,800 | $20,968 |
| 2015 | $275 | $25,768 | $4,800 | $20,968 |
| 2014 | $275 | $25,768 | $4,800 | $20,968 |
Source: Public Records
Map
Nearby Homes
- 2501 Maple Rd SE
- 107 E Linden St SE
- 2508 Maple Rd SE
- 2523 Maple Rd SE
- 211 Alfred Ave SE
- 212 Alfred Ave SE
- 36 Saddle Mountain Rd SE
- 226 Flora Ave SE
- 2710 Maple Rd SE
- 3 Belmont Ct SE
- 15 Saddlebrook Dr SE
- 2107 Rockmart Rd SE
- 2108 Maple Ave SW
- 0 Martha Berry Hwy Unit 7525627
- 0 Martha Berry Hwy Unit 7614774
- 0 Martha Berry Hwy Unit 10563404
- 7 Willingham St SW
- 109 Chateau Dr SE
- 105 Chateau Dr SE
- 8 Azalea St SE
- 0 Azalea St SE Unit 7374687
- 0 Azalea St SE Unit 7620231
- 0 Azalea St SE Unit 7418596
- 0 Azalea St SE Unit 3130564
- 0 Azalea St SE
- 13 Wisteria Dr SE
- 14 Azalea St SE
- 6 Azalea St SE
- 11 Wisteria Dr SE
- 11 Azalea St SE
- 13 Azalea St SE
- 17 Wisteria Dr SE
- 9 Azalea St SE Unit 16
- 9 Azalea St SE
- 9 Wisteria Dr SE
- 16 Azalea St SE
- 4 Azalea St SE
- 15 Azalea St SE
- 7 Azalea St SE