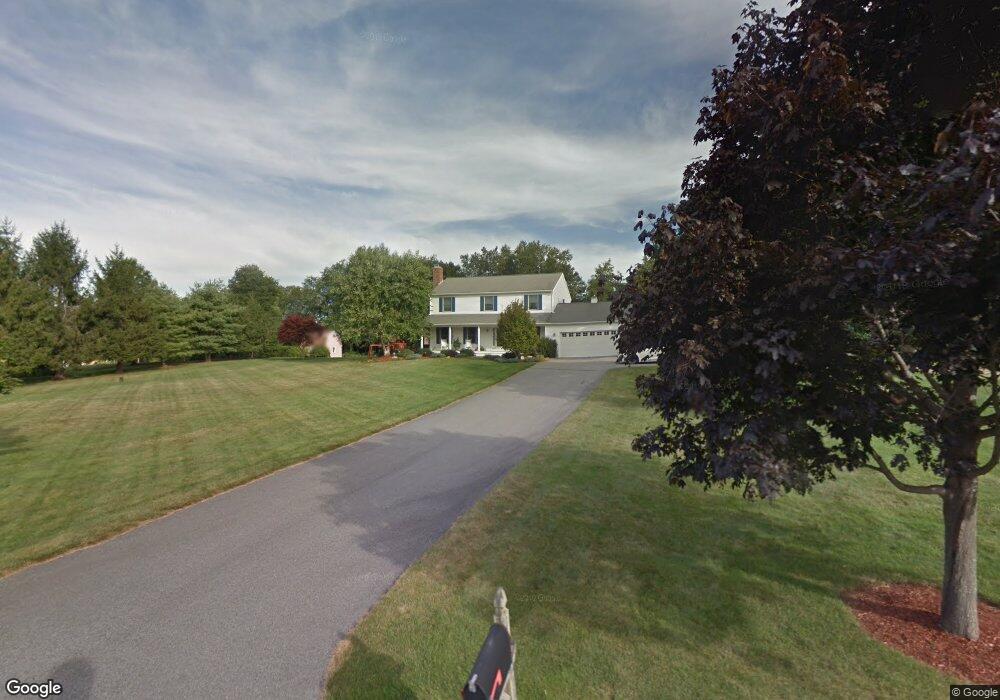
10 Bayberry St Rehoboth, MA 02769
Estimated Value: $644,267 - $980,000
4
Beds
3
Baths
2,080
Sq Ft
$365/Sq Ft
Est. Value
About This Home
This home is located at 10 Bayberry St, Rehoboth, MA 02769 and is currently estimated at $759,567, approximately $365 per square foot. 10 Bayberry St is a home located in Bristol County with nearby schools including Dighton-Rehoboth Regional High School, Highlander Charter Middle and High School, and East Bay Career Academy.
Ownership History
Date
Name
Owned For
Owner Type
Purchase Details
Closed on
Aug 5, 2004
Sold by
Thaler Fredric E and Thaler Elyse M
Bought by
F&E Thaler Ft and Thaler Fredric E
Current Estimated Value
Purchase Details
Closed on
Feb 18, 1999
Sold by
Griffin Jeffrey F
Bought by
Thaler Frrdric E and Thaler Elyse M
Home Financials for this Owner
Home Financials are based on the most recent Mortgage that was taken out on this home.
Original Mortgage
$160,000
Interest Rate
6.75%
Mortgage Type
Purchase Money Mortgage
Create a Home Valuation Report for This Property
The Home Valuation Report is an in-depth analysis detailing your home's value as well as a comparison with similar homes in the area
Home Values in the Area
Average Home Value in this Area
Purchase History
| Date | Buyer | Sale Price | Title Company |
|---|---|---|---|
| F&E Thaler Ft | -- | -- | |
| Thaler Frrdric E | $235,000 | -- |
Source: Public Records
Mortgage History
| Date | Status | Borrower | Loan Amount |
|---|---|---|---|
| Previous Owner | Thaler Frrdric E | $60,000 | |
| Previous Owner | Thaler Frrdric E | $25,000 | |
| Previous Owner | Thaler Frrdric E | $160,000 | |
| Previous Owner | Thaler Frrdric E | $30,000 |
Source: Public Records
Tax History Compared to Growth
Tax History
| Year | Tax Paid | Tax Assessment Tax Assessment Total Assessment is a certain percentage of the fair market value that is determined by local assessors to be the total taxable value of land and additions on the property. | Land | Improvement |
|---|---|---|---|---|
| 2025 | $56 | $503,300 | $174,000 | $329,300 |
| 2024 | $6,028 | $530,600 | $208,600 | $322,000 |
| 2023 | $5,397 | $487,000 | $204,200 | $282,800 |
| 2022 | $5,397 | $426,000 | $187,300 | $238,700 |
| 2021 | $5,227 | $394,800 | $170,700 | $224,100 |
| 2020 | $5,285 | $402,800 | $178,700 | $224,100 |
| 2018 | $4,535 | $378,900 | $170,200 | $208,700 |
| 2017 | $4,436 | $353,200 | $170,200 | $183,000 |
| 2016 | $4,384 | $360,800 | $177,800 | $183,000 |
| 2015 | $4,142 | $336,500 | $169,600 | $166,900 |
| 2014 | $4,083 | $328,200 | $161,300 | $166,900 |
Source: Public Records
Map
Nearby Homes
- 1 Cedarbrook Unit A
- 383 Vinnicum Rd
- 10 Quaker Ln
- 3a Johnnies Way
- 3b Johnnies Way
- 3 Johnnies Way
- 7 Johnnies Way
- 36 Columbine Rd
- 129 Cameron Way
- 17 Sassafras Rd
- 107 Walker St
- 24 Nod Rd
- 283 Plain St
- 0 Old Fall River Rd Unit 73399047
- 92 Martin St
- 75 Martin St
- 1261 Grand Army of the Republic Hwy
- 43 Baptist St
- 16 Martin St
- 267 Chestnut St