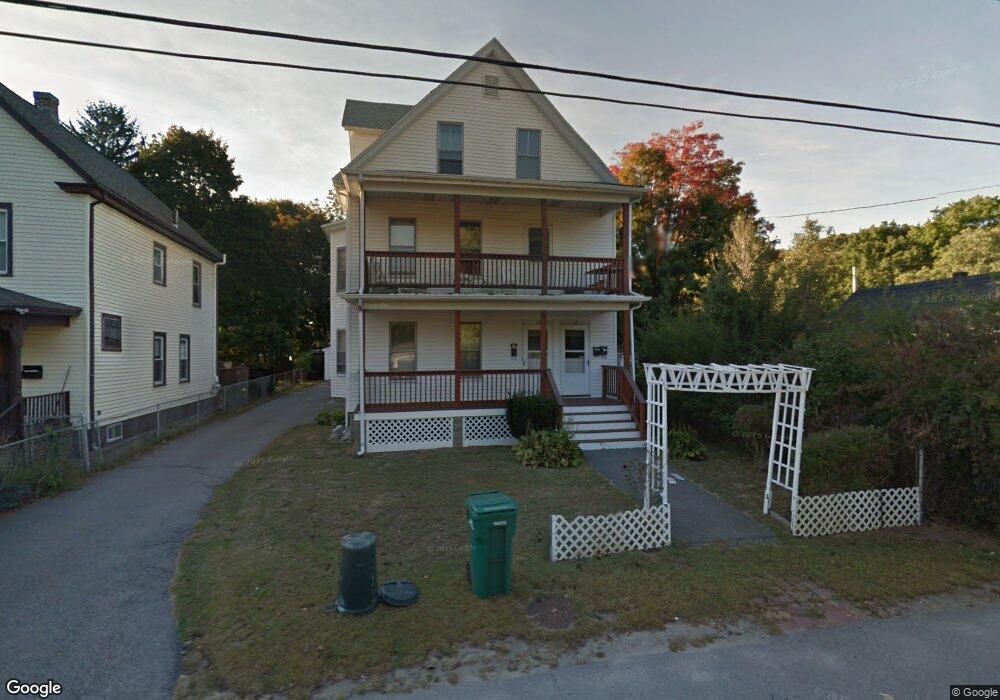
10 Benefit St Attleboro, MA 02703
Estimated Value: $583,000 - $741,000
8
Beds
3
Baths
3,322
Sq Ft
$207/Sq Ft
Est. Value
About This Home
This home is located at 10 Benefit St, Attleboro, MA 02703 and is currently estimated at $686,862, approximately $206 per square foot. 10 Benefit St is a home located in Bristol County with nearby schools including Thomas E. Willett School, Cyril K. Brennan Middle School, and Attleboro High School.
Ownership History
Date
Name
Owned For
Owner Type
Purchase Details
Closed on
Mar 29, 2007
Sold by
Vanscott D and Huynh Thuan Kim
Bought by
Vanscott D
Current Estimated Value
Purchase Details
Closed on
Nov 1, 2001
Sold by
Hallett David R
Bought by
Vanscott D and Huynh Thuan Kim
Home Financials for this Owner
Home Financials are based on the most recent Mortgage that was taken out on this home.
Original Mortgage
$228,375
Interest Rate
6.82%
Mortgage Type
Purchase Money Mortgage
Create a Home Valuation Report for This Property
The Home Valuation Report is an in-depth analysis detailing your home's value as well as a comparison with similar homes in the area
Home Values in the Area
Average Home Value in this Area
Purchase History
| Date | Buyer | Sale Price | Title Company |
|---|---|---|---|
| Vanscott D | -- | -- | |
| Vanscott D | $250,000 | -- |
Source: Public Records
Mortgage History
| Date | Status | Borrower | Loan Amount |
|---|---|---|---|
| Previous Owner | Vanscott D | $228,375 | |
| Previous Owner | Vanscott D | $136,700 |
Source: Public Records
Tax History
| Year | Tax Paid | Tax Assessment Tax Assessment Total Assessment is a certain percentage of the fair market value that is determined by local assessors to be the total taxable value of land and additions on the property. | Land | Improvement |
|---|---|---|---|---|
| 2025 | $7,047 | $561,500 | $121,100 | $440,400 |
| 2024 | $6,804 | $534,500 | $121,100 | $413,400 |
| 2023 | $6,047 | $441,700 | $110,100 | $331,600 |
| 2022 | $5,524 | $382,300 | $104,900 | $277,400 |
| 2021 | $11,076 | $362,000 | $100,800 | $261,200 |
| 2020 | $10,678 | $344,600 | $97,900 | $246,700 |
| 2019 | $10,703 | $335,200 | $96,000 | $239,200 |
| 2018 | $4,350 | $293,500 | $93,200 | $200,300 |
| 2017 | $4,316 | $296,600 | $93,200 | $203,400 |
| 2016 | $3,970 | $267,900 | $91,400 | $176,500 |
| 2015 | $3,739 | $254,200 | $91,400 | $162,800 |
| 2014 | $3,470 | $233,700 | $87,100 | $146,600 |
Source: Public Records
Map
Nearby Homes
- 5 Hope St
- 75 Benefit St
- 5 Foster St
- 0 Rosedale Ln Unit 73469293
- 10 John St
- 28 Pine St Unit C
- 61 Pine St Unit 7
- 64 Mechanic St Unit 3
- 64 Mechanic St
- 75 Dennis St Unit 3
- 36 Hazel St
- 91 East St
- 567 Park St
- 3 Buttonwood Terrace
- 3 Robert St
- 3R Buttonwood Terrace
- 28 Deanville Rd
- 678 N Main St
- 12 Sherman St
- 160 West St
Your Personal Tour Guide
Ask me questions while you tour the home.