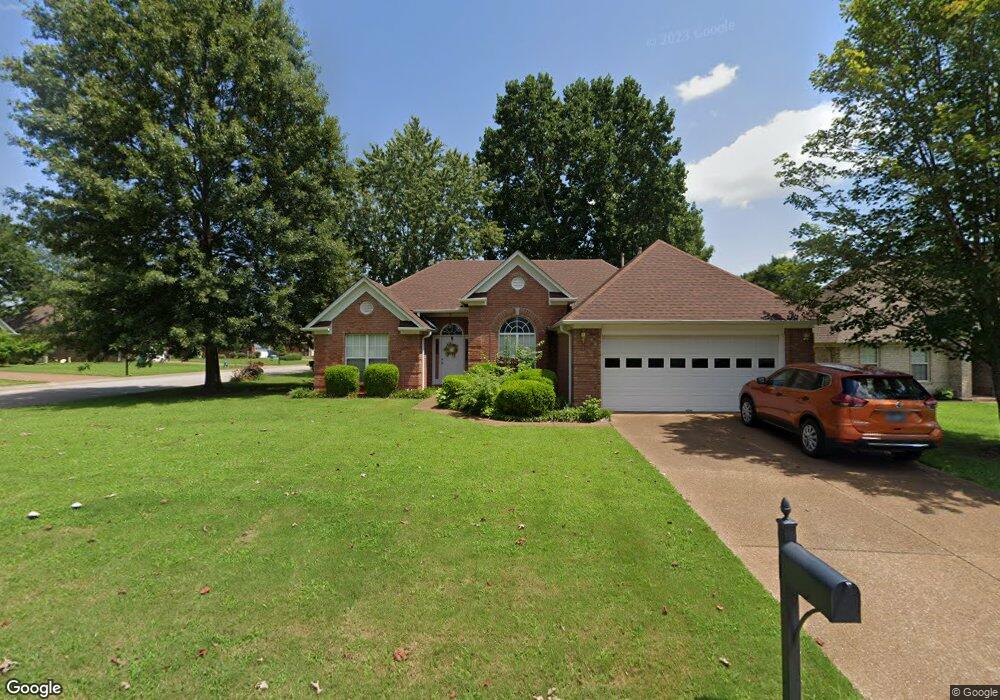
10 Bent Tree Cove Jackson, TN 38305
Estimated Value: $247,384 - $271,000
--
Bed
3
Baths
1,589
Sq Ft
$164/Sq Ft
Est. Value
About This Home
This home is located at 10 Bent Tree Cove, Jackson, TN 38305 and is currently estimated at $261,346, approximately $164 per square foot. 10 Bent Tree Cove is a home located in Madison County with nearby schools including Thelma Barker Elementary School, Northeast Middle School, and North Side High School.
Ownership History
Date
Name
Owned For
Owner Type
Purchase Details
Closed on
Sep 24, 2020
Sold by
Estes and Mark
Bought by
Teague Dennis
Current Estimated Value
Home Financials for this Owner
Home Financials are based on the most recent Mortgage that was taken out on this home.
Original Mortgage
$137,464
Outstanding Balance
$121,990
Interest Rate
2.9%
Mortgage Type
FHA
Estimated Equity
$139,356
Purchase Details
Closed on
Feb 26, 2007
Sold by
Boone Kathleen
Bought by
Estes Yvonne
Purchase Details
Closed on
Jun 4, 2003
Sold by
Walters J B
Bought by
Boone Kathleen
Home Financials for this Owner
Home Financials are based on the most recent Mortgage that was taken out on this home.
Original Mortgage
$116,800
Interest Rate
4.5%
Purchase Details
Closed on
May 30, 2003
Bought by
Boone Kathleen
Home Financials for this Owner
Home Financials are based on the most recent Mortgage that was taken out on this home.
Original Mortgage
$116,800
Interest Rate
4.5%
Create a Home Valuation Report for This Property
The Home Valuation Report is an in-depth analysis detailing your home's value as well as a comparison with similar homes in the area
Home Values in the Area
Average Home Value in this Area
Purchase History
| Date | Buyer | Sale Price | Title Company |
|---|---|---|---|
| Teague Dennis | $140,000 | Rainey Kizer Reviere & Bell Pl | |
| Estes Yvonne | $134,620 | -- | |
| Boone Kathleen | $122,950 | -- | |
| Boone Kathleen | $123,000 | -- |
Source: Public Records
Mortgage History
| Date | Status | Borrower | Loan Amount |
|---|---|---|---|
| Open | Teague Dennis | $137,464 | |
| Previous Owner | Boone Kathleen | $116,800 |
Source: Public Records
Tax History Compared to Growth
Tax History
| Year | Tax Paid | Tax Assessment Tax Assessment Total Assessment is a certain percentage of the fair market value that is determined by local assessors to be the total taxable value of land and additions on the property. | Land | Improvement |
|---|---|---|---|---|
| 2024 | $977 | $52,150 | $8,750 | $43,400 |
| 2022 | $1,817 | $52,150 | $8,750 | $43,400 |
| 2021 | $1,530 | $35,500 | $5,625 | $29,875 |
| 2020 | $1,530 | $35,500 | $5,625 | $29,875 |
| 2019 | $1,530 | $35,500 | $5,625 | $29,875 |
| 2018 | $1,530 | $35,500 | $5,625 | $29,875 |
| 2017 | $1,493 | $33,850 | $5,625 | $28,225 |
| 2016 | $1,392 | $33,850 | $5,625 | $28,225 |
| 2015 | $1,392 | $33,850 | $5,625 | $28,225 |
| 2014 | $1,361 | $33,100 | $5,625 | $27,475 |
Source: Public Records
Map
Nearby Homes
- 404 Fairway Blvd
- 398 Fairway Blvd
- 422 Fairway Blvd
- 428 Fairway Blvd
- 440 Fairway Blvd
- 50 Bent Tree Cove
- 24 Cedar Crest Cove
- 459 Fairway Blvd
- 453 Fairway Blvd
- 447 Fairway Blvd
- 441 Fairway Blvd
- 435 Fairway Blvd
- 429 Fairway Blvd
- 403 Fairway Blvd
- 42 Mallory Dr
- 50 Brookwood Dr
- 50 Garrison Dr
- 68 Brookwood Dr
- 179 Fairway Blvd
- 78 Doe Valley Cove
- 18 Bent Tree Cove
- 7 Edgewater Cove
- 19 Edgewater Cove
- 26 Bent Tree Cove
- 313 Fairway Blvd
- 305 Fairway Blvd
- 9 Bent Tree Cove
- 19 Bent Tree Cove
- 321 Fairway Blvd
- 297 Fairway Blvd
- 27 Edgewater Cove
- 27 Bent Tree Cove
- 34 Bent Tree Cove
- 329 Fairway Blvd
- 289 Fairway Blvd
- 35 Edgewater Cove
- 280 Fairway Blvd
- 30 Cedar Crest Cove
- 35 Bent Tree Cove
- 6 Roanoak Cove