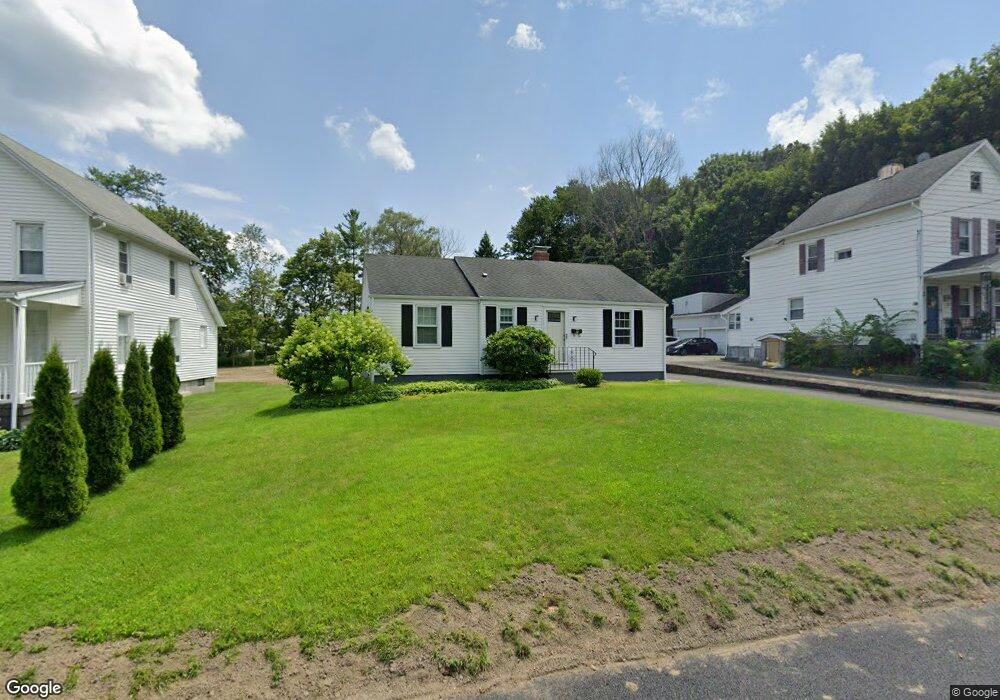
10 Blaine St Danbury, CT 06810
Estimated Value: $305,000 - $360,921
2
Beds
1
Bath
924
Sq Ft
$360/Sq Ft
Est. Value
About This Home
This home is located at 10 Blaine St, Danbury, CT 06810 and is currently estimated at $332,730, approximately $360 per square foot. 10 Blaine St is a home located in Fairfield County with nearby schools including Morris Street Elementary School, Rogers Park Middle School, and Danbury High School.
Ownership History
Date
Name
Owned For
Owner Type
Purchase Details
Closed on
Nov 16, 2022
Sold by
Moyle Robert G
Bought by
Moyle Robert G and Murphy Barbara A
Current Estimated Value
Purchase Details
Closed on
Nov 19, 2003
Sold by
Moyle William
Bought by
Moyle Rbt
Home Financials for this Owner
Home Financials are based on the most recent Mortgage that was taken out on this home.
Original Mortgage
$90,000
Interest Rate
4.75%
Create a Home Valuation Report for This Property
The Home Valuation Report is an in-depth analysis detailing your home's value as well as a comparison with similar homes in the area
Home Values in the Area
Average Home Value in this Area
Purchase History
| Date | Buyer | Sale Price | Title Company |
|---|---|---|---|
| Moyle Robert G | -- | None Available | |
| Moyle Rbt | $90,000 | -- |
Source: Public Records
Mortgage History
| Date | Status | Borrower | Loan Amount |
|---|---|---|---|
| Previous Owner | Moyle Rbt | $90,000 |
Source: Public Records
Tax History Compared to Growth
Tax History
| Year | Tax Paid | Tax Assessment Tax Assessment Total Assessment is a certain percentage of the fair market value that is determined by local assessors to be the total taxable value of land and additions on the property. | Land | Improvement |
|---|---|---|---|---|
| 2025 | $4,517 | $180,740 | $62,720 | $118,020 |
| 2024 | $4,417 | $180,740 | $62,720 | $118,020 |
| 2023 | $4,217 | $180,740 | $62,720 | $118,020 |
| 2022 | $3,804 | $134,800 | $67,700 | $67,100 |
| 2021 | $3,720 | $134,800 | $67,700 | $67,100 |
| 2020 | $3,720 | $134,800 | $67,700 | $67,100 |
| 2019 | $3,720 | $134,800 | $67,700 | $67,100 |
| 2018 | $3,720 | $134,800 | $67,700 | $67,100 |
| 2017 | $3,520 | $121,600 | $64,500 | $57,100 |
| 2016 | $3,487 | $121,600 | $64,500 | $57,100 |
| 2015 | $3,436 | $121,600 | $64,500 | $57,100 |
| 2014 | $3,356 | $121,600 | $64,500 | $57,100 |
Source: Public Records
Map
Nearby Homes