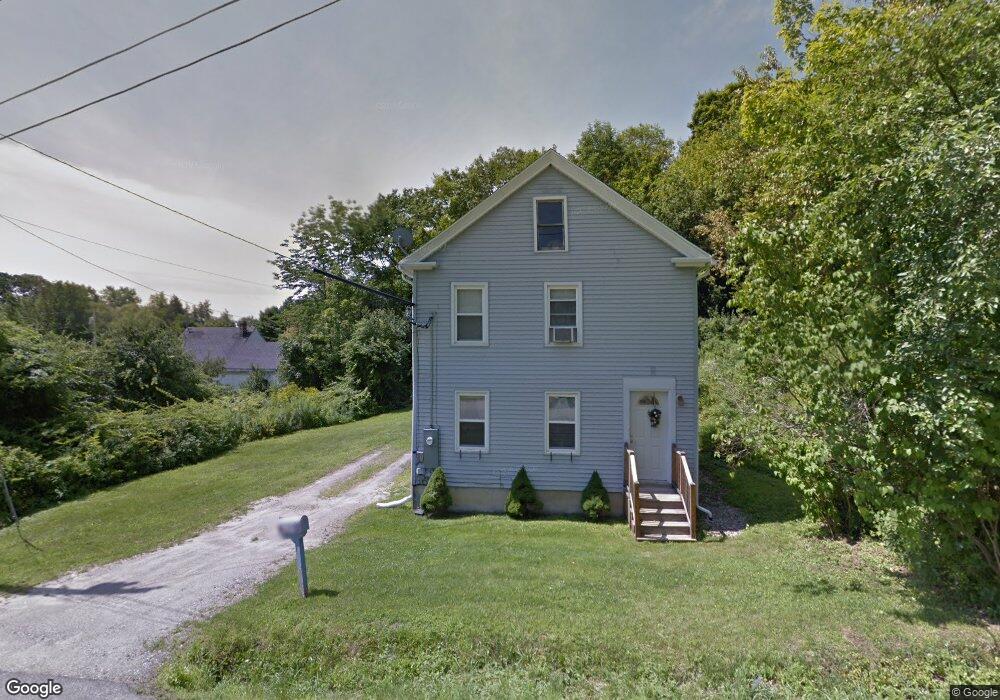
10 Bridge St Richmond, ME 04357
Estimated Value: $180,338 - $273,000
2
Beds
1
Bath
1,012
Sq Ft
$215/Sq Ft
Est. Value
About This Home
This home is located at 10 Bridge St, Richmond, ME 04357 and is currently estimated at $217,585, approximately $215 per square foot. 10 Bridge St is a home located in Sagadahoc County with nearby schools including Marcia Buker School, Dresden Elementary School, and Monmouth Memorial School.
Ownership History
Date
Name
Owned For
Owner Type
Purchase Details
Closed on
Sep 28, 2007
Sold by
Riegler Harold M and Riegler Carolyn M
Bought by
Cerrone Joanne E
Current Estimated Value
Home Financials for this Owner
Home Financials are based on the most recent Mortgage that was taken out on this home.
Original Mortgage
$108,066
Outstanding Balance
$69,011
Interest Rate
6.65%
Mortgage Type
FHA
Estimated Equity
$148,574
Purchase Details
Closed on
Apr 27, 2005
Sold by
Levesque Randy A and Levesque Sandra L
Bought by
Riegler Harold M and Riegler Carolyn M
Home Financials for this Owner
Home Financials are based on the most recent Mortgage that was taken out on this home.
Original Mortgage
$79,600
Interest Rate
5.95%
Mortgage Type
Purchase Money Mortgage
Create a Home Valuation Report for This Property
The Home Valuation Report is an in-depth analysis detailing your home's value as well as a comparison with similar homes in the area
Home Values in the Area
Average Home Value in this Area
Purchase History
| Date | Buyer | Sale Price | Title Company |
|---|---|---|---|
| Cerrone Joanne E | -- | -- | |
| Riegler Harold M | -- | -- |
Source: Public Records
Mortgage History
| Date | Status | Borrower | Loan Amount |
|---|---|---|---|
| Open | Cerrone Joanne E | $108,066 | |
| Previous Owner | Riegler Harold M | $79,600 |
Source: Public Records
Tax History
| Year | Tax Paid | Tax Assessment Tax Assessment Total Assessment is a certain percentage of the fair market value that is determined by local assessors to be the total taxable value of land and additions on the property. | Land | Improvement |
|---|---|---|---|---|
| 2024 | $1,871 | $79,300 | $30,300 | $49,000 |
| 2023 | $1,705 | $79,300 | $30,300 | $49,000 |
| 2022 | $1,550 | $79,300 | $30,300 | $49,000 |
| 2021 | $1,550 | $79,300 | $30,300 | $49,000 |
| 2020 | $1,550 | $79,300 | $30,300 | $49,000 |
| 2019 | $1,550 | $79,300 | $30,300 | $49,000 |
| 2018 | $1,550 | $79,300 | $30,300 | $49,000 |
| 2017 | $1,550 | $79,300 | $30,300 | $49,000 |
| 2016 | $1,519 | $79,300 | $30,300 | $49,000 |
| 2015 | $1,483 | $79,300 | $30,300 | $49,000 |
| 2014 | $1,530 | $79,300 | $30,300 | $49,000 |
| 2013 | $1,435 | $79,300 | $30,300 | $49,000 |
Source: Public Records
Map
Nearby Homes
Your Personal Tour Guide
Ask me questions while you tour the home.