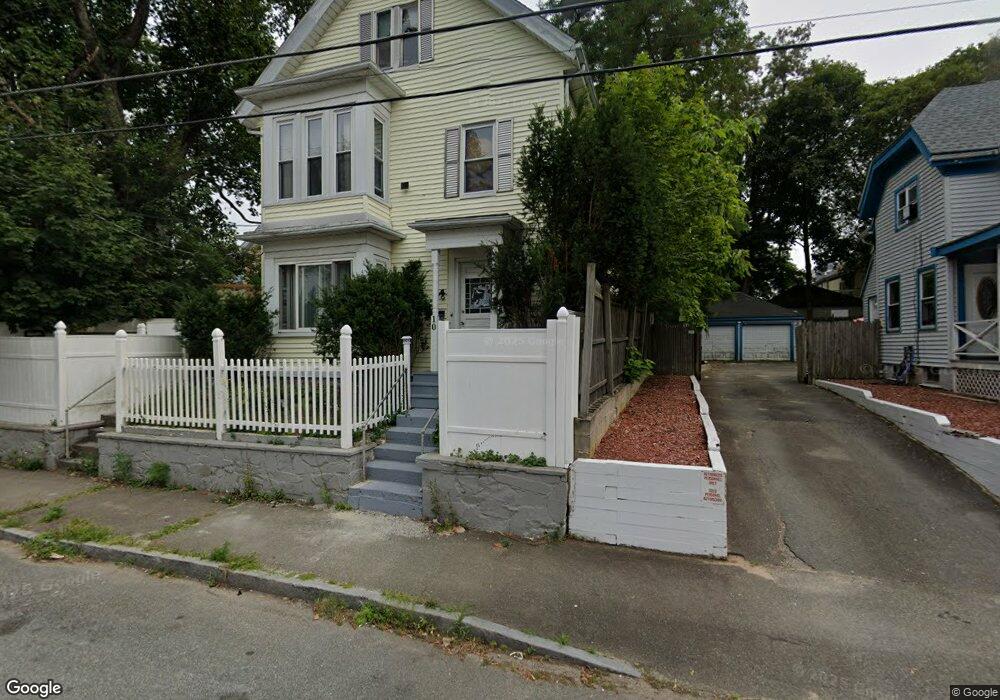
10 Brunswick St Brockton, MA 02301
Estimated Value: $563,000 - $710,000
7
Beds
2
Baths
2,154
Sq Ft
$299/Sq Ft
Est. Value
About This Home
This home is located at 10 Brunswick St, Brockton, MA 02301 and is currently estimated at $645,064, approximately $299 per square foot. 10 Brunswick St is a home located in Plymouth County with nearby schools including Arnone Elementary School, Joseph F. Plouffe Middle School, and Brockton Area Seventh-Day Adventist Academy.
Ownership History
Date
Name
Owned For
Owner Type
Purchase Details
Closed on
Sep 22, 2004
Sold by
Cataldo Lucinda M and Cataldo Scott D
Bought by
Sydney Marjorie
Current Estimated Value
Home Financials for this Owner
Home Financials are based on the most recent Mortgage that was taken out on this home.
Original Mortgage
$215,600
Outstanding Balance
$106,885
Interest Rate
5.89%
Mortgage Type
Purchase Money Mortgage
Estimated Equity
$538,179
Purchase Details
Closed on
Aug 23, 1999
Sold by
Robinson Eron A
Bought by
Federal National Mortgage Association
Purchase Details
Closed on
Mar 25, 1988
Sold by
Guillemette F C
Bought by
Robinson Eron
Home Financials for this Owner
Home Financials are based on the most recent Mortgage that was taken out on this home.
Original Mortgage
$117,000
Interest Rate
9.82%
Mortgage Type
Purchase Money Mortgage
Create a Home Valuation Report for This Property
The Home Valuation Report is an in-depth analysis detailing your home's value as well as a comparison with similar homes in the area
Home Values in the Area
Average Home Value in this Area
Purchase History
| Date | Buyer | Sale Price | Title Company |
|---|---|---|---|
| Sydney Marjorie | $280,000 | -- | |
| Federal National Mortgage Association | $119,000 | -- | |
| Robinson Eron | $130,000 | -- |
Source: Public Records
Mortgage History
| Date | Status | Borrower | Loan Amount |
|---|---|---|---|
| Open | Robinson Eron | $215,600 | |
| Closed | Robinson Eron | $56,000 | |
| Previous Owner | Robinson Eron | $117,000 | |
| Previous Owner | Robinson Eron | $75,000 |
Source: Public Records
Tax History Compared to Growth
Tax History
| Year | Tax Paid | Tax Assessment Tax Assessment Total Assessment is a certain percentage of the fair market value that is determined by local assessors to be the total taxable value of land and additions on the property. | Land | Improvement |
|---|---|---|---|---|
| 2025 | $7,040 | $581,300 | $127,100 | $454,200 |
| 2024 | $6,962 | $579,200 | $127,100 | $452,100 |
| 2023 | $5,729 | $441,400 | $97,100 | $344,300 |
| 2022 | $5,870 | $420,200 | $87,600 | $332,600 |
| 2021 | $0 | $371,400 | $71,700 | $299,700 |
| 2020 | $4,948 | $326,600 | $68,700 | $257,900 |
| 2019 | $5,416 | $348,500 | $64,600 | $283,900 |
| 2018 | $0 | $272,700 | $64,600 | $208,100 |
| 2017 | $0 | $255,900 | $64,600 | $191,300 |
| 2016 | $3,939 | $226,900 | $62,600 | $164,300 |
| 2015 | $2,831 | $156,000 | $62,600 | $93,400 |
| 2014 | $2,995 | $165,200 | $62,600 | $102,600 |
Source: Public Records
Map
Nearby Homes
- 14 Brunswick St
- 35 Brett St
- 39 Brett St
- 11 Brunswick St
- 22 Brunswick St
- 9 Kensington Place
- 27 Brett St
- 9 Brunswick St Unit 3
- 9 Brunswick St Unit 2
- 9 Brunswick St Unit 1
- 9 Brunswick St Unit 9-Unit 2
- 45 Brett St
- 15 Brunswick St
- 15 Kensington Place
- 21 Kensington Place
- 19 Brunswick St
- 23 Brett St
- 23 Brett St Unit 1
- 23 Brett St Unit 3
- 38 Brett St