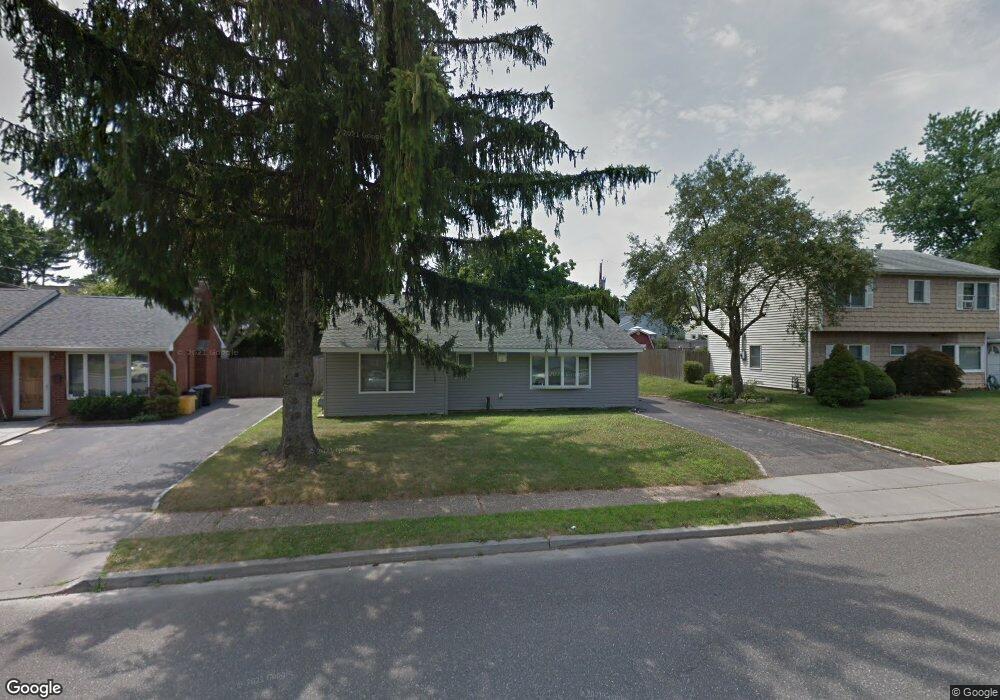
10 Bryant Rd Glen Cove, NY 11542
Estimated Value: $625,517 - $662,000
--
Bed
1
Bath
1,262
Sq Ft
$510/Sq Ft
Est. Value
About This Home
This home is located at 10 Bryant Rd, Glen Cove, NY 11542 and is currently estimated at $643,759, approximately $510 per square foot. 10 Bryant Rd is a home located in Nassau County with nearby schools including North Shore Middle School, North Shore Senior High School, and Friends Academy.
Ownership History
Date
Name
Owned For
Owner Type
Purchase Details
Closed on
Mar 2, 2010
Sold by
Lopez Bradley
Bought by
Oddo Joseph F and Oddo Craig J
Current Estimated Value
Home Financials for this Owner
Home Financials are based on the most recent Mortgage that was taken out on this home.
Original Mortgage
$260,480
Outstanding Balance
$173,243
Interest Rate
5.05%
Mortgage Type
FHA
Estimated Equity
$470,516
Purchase Details
Closed on
Aug 10, 2005
Sold by
Desimone Angela
Bought by
Lopez Bradley
Create a Home Valuation Report for This Property
The Home Valuation Report is an in-depth analysis detailing your home's value as well as a comparison with similar homes in the area
Home Values in the Area
Average Home Value in this Area
Purchase History
| Date | Buyer | Sale Price | Title Company |
|---|---|---|---|
| Oddo Joseph F | $320,000 | -- | |
| Lopez Bradley | $369,000 | -- |
Source: Public Records
Mortgage History
| Date | Status | Borrower | Loan Amount |
|---|---|---|---|
| Open | Oddo Joseph F | $260,480 |
Source: Public Records
Tax History Compared to Growth
Tax History
| Year | Tax Paid | Tax Assessment Tax Assessment Total Assessment is a certain percentage of the fair market value that is determined by local assessors to be the total taxable value of land and additions on the property. | Land | Improvement |
|---|---|---|---|---|
| 2025 | $9,529 | $422 | $205 | $217 |
| 2024 | $3,224 | $418 | $203 | $215 |
| 2023 | $9,424 | $473 | $229 | $244 |
| 2022 | $9,424 | $484 | $235 | $249 |
| 2021 | $9,015 | $475 | $230 | $245 |
| 2020 | $8,184 | $641 | $640 | $1 |
| 2019 | $7,752 | $687 | $611 | $76 |
| 2018 | $7,868 | $733 | $0 | $0 |
| 2017 | $4,986 | $800 | $711 | $89 |
| 2016 | $8,436 | $800 | $711 | $89 |
| 2015 | $3,102 | $800 | $711 | $89 |
| 2014 | $3,102 | $800 | $711 | $89 |
| 2013 | $2,812 | $800 | $711 | $89 |
Source: Public Records
Map
Nearby Homes