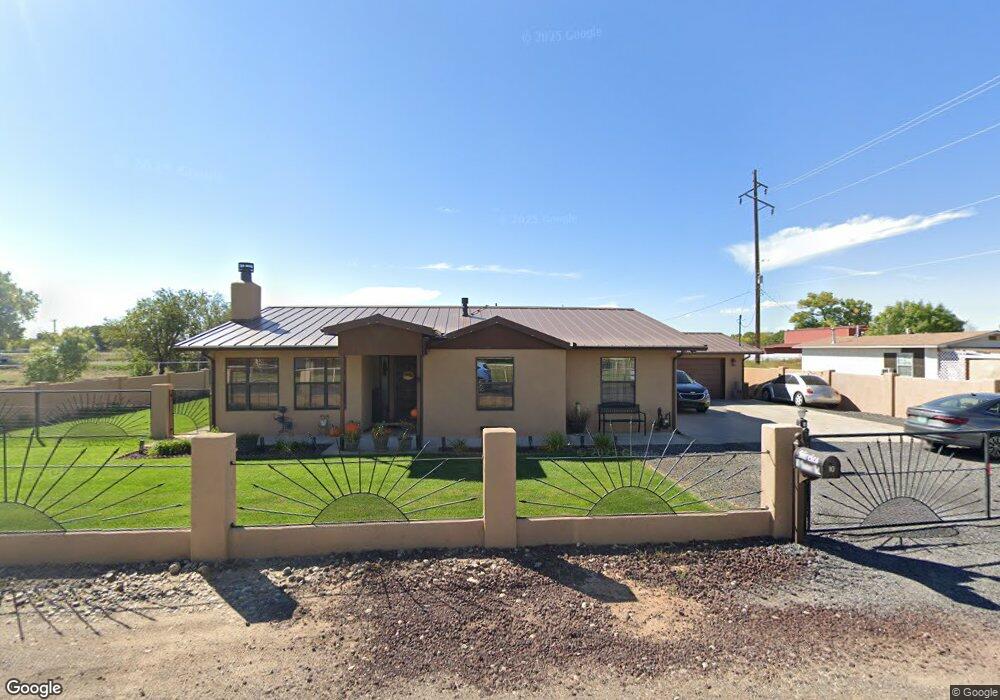
10 Bunton Rd Belen, NM 87002
Los Chavez NeighborhoodEstimated Value: $353,000 - $414,552
3
Beds
2
Baths
2,127
Sq Ft
$180/Sq Ft
Est. Value
About This Home
This home is located at 10 Bunton Rd, Belen, NM 87002 and is currently estimated at $382,388, approximately $179 per square foot. 10 Bunton Rd is a home located in Valencia County with nearby schools including Belen High School and Canon Christian Academy.
Ownership History
Date
Name
Owned For
Owner Type
Purchase Details
Closed on
Oct 29, 2021
Sold by
A & A Land Llc
Bought by
Mireles Marissa Lyn
Current Estimated Value
Home Financials for this Owner
Home Financials are based on the most recent Mortgage that was taken out on this home.
Original Mortgage
$65,000
Outstanding Balance
$15,990
Interest Rate
2.8%
Mortgage Type
New Conventional
Estimated Equity
$366,398
Purchase Details
Closed on
May 5, 2021
Sold by
Mireles Monica L and Mireles Carlos P
Bought by
County Of Valencia
Purchase Details
Closed on
Mar 22, 2021
Sold by
Garley Ida C
Bought by
Mireles Kevin L
Purchase Details
Closed on
May 29, 2007
Sold by
Flores Esther C
Bought by
Mireles Carlos P and Mireles Monica L
Home Financials for this Owner
Home Financials are based on the most recent Mortgage that was taken out on this home.
Original Mortgage
$166,400
Interest Rate
6.17%
Mortgage Type
New Conventional
Create a Home Valuation Report for This Property
The Home Valuation Report is an in-depth analysis detailing your home's value as well as a comparison with similar homes in the area
Home Values in the Area
Average Home Value in this Area
Purchase History
| Date | Buyer | Sale Price | Title Company |
|---|---|---|---|
| Mireles Marissa Lyn | -- | Fidelity National Ttl Ins Co | |
| County Of Valencia | -- | None Available | |
| Mireles Kevin L | -- | None Available | |
| Mireles Carlos P | -- | First American Title Ins Co |
Source: Public Records
Mortgage History
| Date | Status | Borrower | Loan Amount |
|---|---|---|---|
| Open | Mireles Marissa Lyn | $65,000 | |
| Previous Owner | Mireles Carlos P | $166,400 |
Source: Public Records
Tax History Compared to Growth
Tax History
| Year | Tax Paid | Tax Assessment Tax Assessment Total Assessment is a certain percentage of the fair market value that is determined by local assessors to be the total taxable value of land and additions on the property. | Land | Improvement |
|---|---|---|---|---|
| 2024 | $1,996 | $80,048 | $12,450 | $67,598 |
| 2023 | $1,996 | $68,356 | $12,450 | $55,906 |
| 2022 | $1,860 | $66,365 | $15,000 | $51,365 |
| 2021 | $1,695 | $64,433 | $15,450 | $48,983 |
| 2020 | $1,660 | $62,556 | $15,000 | $47,556 |
| 2019 | $1,657 | $62,556 | $15,000 | $47,556 |
| 2018 | $1,642 | $62,556 | $15,000 | $47,556 |
| 2017 | $1,626 | $62,556 | $15,000 | $47,556 |
| 2016 | $1,594 | $62,556 | $15,000 | $47,556 |
| 2015 | -- | $62,556 | $15,000 | $47,556 |
| 2013 | -- | $72,457 | $17,374 | $55,083 |
| 2011 | -- | $211,041 | $50,604 | $160,437 |
Source: Public Records
Map
Nearby Homes
- 11 Bunton Rd
- 19780 Highway 314
- 4 Los Chavez Park Rd
- 12 Casitas Del Rio
- 171 Camino de Los Chavez
- 1 Calle de Oro
- 5159 Paloma Ave
- 4927 Georgia St
- 4916 Moore Cir
- 4843 Highway 314 SW
- 8 James Sanchez Ln
- 91 Camino de Los Chavez
- 0 SW Corner Cut Tree & Seabell Rd Unit 1069028
- TBD SW Corner Cut Tree & Seabell Rd
- 6 Palo Alto Rd
- 17 Vicente Rd
- 26 Jamerson Rd
- 19649 Highway 314
- .14 Acres Near Church Town Loop
- 4235 Highway 314 SW
- 3 Bunton Rd
- 12A Bunton Rd
- 12 Bunton Rd
- 0 Bunton Rd
- 19764 New Mexico 314
- 5 Bunton Rd
- 7A Bunton Rd
- 1 Bunton Rd
- 0 White Angel Unit 963312
- 0 White Angel Unit 674041
- 0 White Angel Unit 674040
- 0 Montoya Rd
- 25 Bunton Rd
- 5 White Angel Ct
- 19778 New Mexico 314
- 45 Los Chavez Park Rd
- 22 Bunton Rd
- 14 Bunton Rd
- 16 Bunton Rd
- 19765 Highway 314