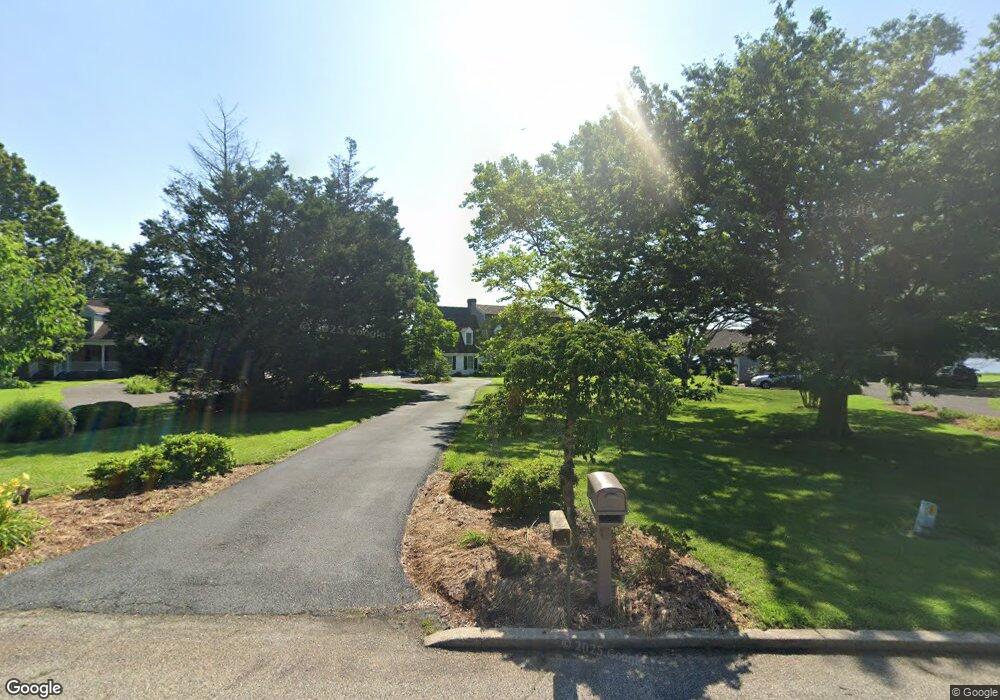
10 Byford Ct Chestertown, MD 21620
Estimated Value: $1,064,000 - $1,185,000
--
Bed
4
Baths
3,787
Sq Ft
$298/Sq Ft
Est. Value
About This Home
This home is located at 10 Byford Ct, Chestertown, MD 21620 and is currently estimated at $1,127,194, approximately $297 per square foot. 10 Byford Ct is a home located in Kent County with nearby schools including Center for Innovation, Kent County Middle School, and Kent County High School.
Ownership History
Date
Name
Owned For
Owner Type
Purchase Details
Closed on
Dec 1, 1993
Sold by
Robert Oliver & Margaret K. Trust
Bought by
Conkling John A and Conkling Sandra M
Current Estimated Value
Home Financials for this Owner
Home Financials are based on the most recent Mortgage that was taken out on this home.
Original Mortgage
$360,000
Interest Rate
7.31%
Purchase Details
Closed on
Oct 6, 1982
Sold by
Bright James P and Bright Gabrielle W
Bought by
Oliver Robert T and Oliver Margaret K
Create a Home Valuation Report for This Property
The Home Valuation Report is an in-depth analysis detailing your home's value as well as a comparison with similar homes in the area
Home Values in the Area
Average Home Value in this Area
Purchase History
| Date | Buyer | Sale Price | Title Company |
|---|---|---|---|
| Conkling John A | $450,000 | -- | |
| Oliver Robert T | $219,000 | -- |
Source: Public Records
Mortgage History
| Date | Status | Borrower | Loan Amount |
|---|---|---|---|
| Closed | Conkling John A | $360,000 |
Source: Public Records
Tax History Compared to Growth
Tax History
| Year | Tax Paid | Tax Assessment Tax Assessment Total Assessment is a certain percentage of the fair market value that is determined by local assessors to be the total taxable value of land and additions on the property. | Land | Improvement |
|---|---|---|---|---|
| 2025 | $13,411 | $855,700 | $456,800 | $398,900 |
| 2024 | $12,952 | $826,467 | $0 | $0 |
| 2023 | $12,494 | $797,233 | $0 | $0 |
| 2022 | $11,959 | $768,000 | $456,800 | $311,200 |
| 2021 | $11,913 | $764,067 | $0 | $0 |
| 2020 | $11,913 | $760,133 | $0 | $0 |
| 2019 | $11,827 | $756,200 | $456,800 | $299,400 |
| 2018 | $11,751 | $756,167 | $0 | $0 |
| 2017 | $11,247 | $756,133 | $0 | $0 |
| 2016 | -- | $756,100 | $0 | $0 |
| 2015 | $8,788 | $756,100 | $0 | $0 |
| 2014 | $8,788 | $756,100 | $0 | $0 |
Source: Public Records
Map
Nearby Homes
- 303 E Campus Ave
- 0 East St
- 200 Washington Ave
- 105 High St
- 206 Valley Rd
- 204 Rolling Rd
- 228 S Water St
- 222 Mount Vernon Ave
- 349 & 351 High St
- 206 S Water St
- 349 High St
- 206 Cannon St
- 411 Greenwood Ave
- 0 Elm St Unit MDKE2003590
- 234 N College Ave
- 517 High St
- 423 Calvert St
- 109 S College Ave
- 141 Prospect St
- 304 Hadaway Dr