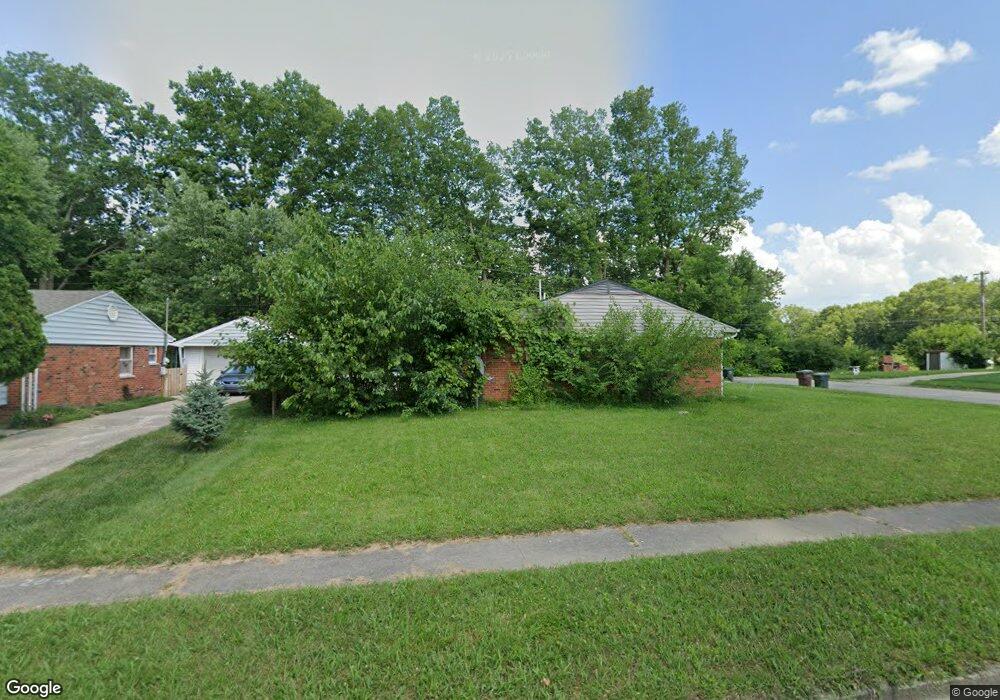
10 Caisson St Dayton, OH 45426
Estimated Value: $149,000 - $175,000
2
Beds
1
Bath
1,713
Sq Ft
$94/Sq Ft
Est. Value
About This Home
This home is located at 10 Caisson St, Dayton, OH 45426 and is currently estimated at $161,864, approximately $94 per square foot. 10 Caisson St is a home located in Montgomery County with nearby schools including Trotwood-Madison Middle School, Trotwood-Madison High School, and Trotwood Preparatory & Fitness Academy.
Ownership History
Date
Name
Owned For
Owner Type
Purchase Details
Closed on
Jan 27, 2012
Sold by
Ohio Investments Llc
Bought by
Trotwood Properties Lp
Current Estimated Value
Purchase Details
Closed on
Jan 28, 2010
Sold by
Peterson Annette
Bought by
Citimortgage Inc
Purchase Details
Closed on
Jan 13, 2010
Sold by
Citimortgage Inc
Bought by
The Secretary Of Housing & Urban Develop
Purchase Details
Closed on
Jul 18, 1994
Sold by
Cook Richard E and Cook Judy
Bought by
Peterson Annette
Create a Home Valuation Report for This Property
The Home Valuation Report is an in-depth analysis detailing your home's value as well as a comparison with similar homes in the area
Home Values in the Area
Average Home Value in this Area
Purchase History
| Date | Buyer | Sale Price | Title Company |
|---|---|---|---|
| Trotwood Properties Lp | $17,500 | Home Services Title Llc | |
| Citimortgage Inc | $46,000 | None Available | |
| The Secretary Of Housing & Urban Develop | -- | Attorney | |
| Peterson Annette | -- | -- |
Source: Public Records
Tax History
| Year | Tax Paid | Tax Assessment Tax Assessment Total Assessment is a certain percentage of the fair market value that is determined by local assessors to be the total taxable value of land and additions on the property. | Land | Improvement |
|---|---|---|---|---|
| 2025 | -- | $29,240 | $4,480 | $24,760 |
| 2024 | -- | $29,240 | $4,480 | $24,760 |
| 2023 | $0 | $29,240 | $4,480 | $24,760 |
| 2022 | $1,960 | $22,870 | $3,500 | $19,370 |
| 2021 | $1,963 | $22,870 | $3,500 | $19,370 |
| 2020 | $1,938 | $22,870 | $3,500 | $19,370 |
| 2019 | $582 | $6,130 | $5,430 | $700 |
| 2018 | $604 | $6,130 | $5,430 | $700 |
| 2017 | $600 | $6,130 | $5,430 | $700 |
| 2016 | $600 | $6,130 | $5,430 | $700 |
| 2015 | $591 | $6,130 | $5,430 | $700 |
| 2014 | $591 | $6,130 | $5,430 | $700 |
| 2012 | -- | $13,320 | $5,430 | $7,890 |
Source: Public Records
Map
Nearby Homes
- 16 Hillgard St
- 118 Stubbs Dr
- 63 Soloman St
- 98 Gump Place
- 20 Macgregor Dr
- 708 Burman Ave
- 4 Pleasant Ave
- 623 Macmillan Dr
- 417 Vaniman Ave
- 709 N Eppington Dr
- 211 E Sunrise Ave
- 30 Sunnybrook Ct
- 6413 Post Town Rd
- 103 Oak St
- 0 Trotwood Blvd Unit 952242
- 6765 Little Richmond Rd
- 0 Little Richmond Rd
- 512 N Sherry Dr
- 7540 Tuscola Dr
- 5353 Little Richmond Rd
Your Personal Tour Guide
Ask me questions while you tour the home.