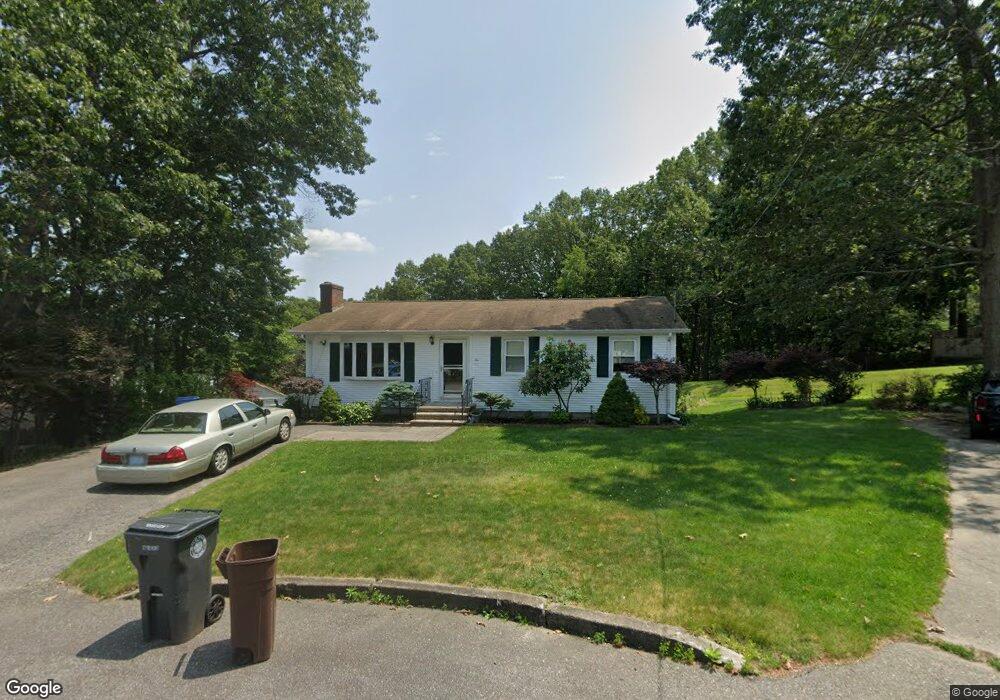
10 Canterbury Ct Cranston, RI 02920
Budlong NeighborhoodEstimated Value: $424,000 - $507,000
3
Beds
2
Baths
1,122
Sq Ft
$412/Sq Ft
Est. Value
About This Home
This home is located at 10 Canterbury Ct, Cranston, RI 02920 and is currently estimated at $462,099, approximately $411 per square foot. 10 Canterbury Ct is a home located in Providence County with nearby schools including Woodridge Elementary School, Western Hills Middle School, and Cranston High School West.
Ownership History
Date
Name
Owned For
Owner Type
Purchase Details
Closed on
Jul 21, 2021
Sold by
Santonastaso Pasquale and Santonastaso Josefina
Bought by
Santonastaso Josefina and Santonastaso Maria
Current Estimated Value
Purchase Details
Closed on
Oct 19, 2016
Sold by
Santonastaso Pasquale and Santonastaso Josefina
Bought by
Santonastaso Pasquale and Santonastaso Josefina
Create a Home Valuation Report for This Property
The Home Valuation Report is an in-depth analysis detailing your home's value as well as a comparison with similar homes in the area
Home Values in the Area
Average Home Value in this Area
Purchase History
| Date | Buyer | Sale Price | Title Company |
|---|---|---|---|
| Santonastaso Josefina | -- | None Available | |
| Santonastaso Pasquale | -- | -- |
Source: Public Records
Mortgage History
| Date | Status | Borrower | Loan Amount |
|---|---|---|---|
| Previous Owner | Santonastaso Pasquale | $75,000 | |
| Previous Owner | Santonastaso Pasquale | $50,000 |
Source: Public Records
Tax History Compared to Growth
Tax History
| Year | Tax Paid | Tax Assessment Tax Assessment Total Assessment is a certain percentage of the fair market value that is determined by local assessors to be the total taxable value of land and additions on the property. | Land | Improvement |
|---|---|---|---|---|
| 2025 | $5,537 | $398,900 | $149,700 | $249,200 |
| 2024 | $5,429 | $398,900 | $149,700 | $249,200 |
| 2023 | $5,506 | $291,300 | $107,100 | $184,200 |
| 2022 | $5,392 | $291,300 | $107,100 | $184,200 |
| 2021 | $5,243 | $291,300 | $107,100 | $184,200 |
| 2020 | $5,205 | $250,600 | $110,900 | $139,700 |
| 2019 | $5,205 | $250,600 | $110,900 | $139,700 |
| 2018 | $5,085 | $250,600 | $110,900 | $139,700 |
| 2017 | $5,010 | $218,400 | $99,400 | $119,000 |
| 2016 | $4,903 | $218,400 | $99,400 | $119,000 |
| 2015 | $4,903 | $218,400 | $99,400 | $119,000 |
| 2014 | $4,164 | $205,800 | $95,600 | $110,200 |
Source: Public Records
Map
Nearby Homes
- 0 Rutland St
- 69 W View Ave
- 446 Budlong Rd
- 99 Salem Ave
- 38 Brettonwoods Dr
- 210 Hyde St
- 10 Sheffield Rd
- 141 Glen Ridge Rd
- 111 Belgium St
- 46 Lilyana Way
- 21 Charles St
- 28 Hybrid Dr
- 71 Norton Ave
- 275 Meshanticut Valley Pkwy
- 46 Roslyn Ave
- 34 Aldrich Ave
- 80 Phenix Ave
- 55 Columbus Blvd
- 92 Rhode Island St
- 132 Fordson Ave Unit 12