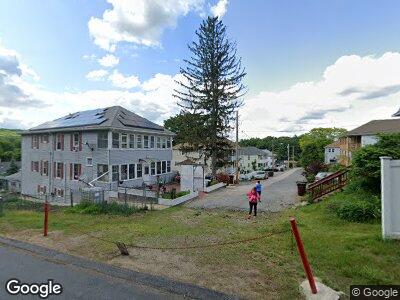
10 Caroline St Auburn, MA 01501
Stoneville NeighborhoodEstimated Value: $465,176 - $610,000
6
Beds
3
Baths
2,440
Sq Ft
$211/Sq Ft
Est. Value
About This Home
This home is located at 10 Caroline St, Auburn, MA 01501 and is currently estimated at $515,294, approximately $211 per square foot. 10 Caroline St is a home located in Worcester County with nearby schools including Auburn Senior High School, Canterbury Street School, and Shrewsbury Montessori School - Auburn Campus.
Ownership History
Date
Name
Owned For
Owner Type
Purchase Details
Closed on
Jul 28, 2022
Sold by
Rutelonis Judith A
Bought by
J A Rutelonis Ret 2022
Current Estimated Value
Purchase Details
Closed on
May 31, 1994
Sold by
Est Albert Rutelonis and Rutelonis Judith
Bought by
Rutelonis Judith
Create a Home Valuation Report for This Property
The Home Valuation Report is an in-depth analysis detailing your home's value as well as a comparison with similar homes in the area
Home Values in the Area
Average Home Value in this Area
Purchase History
| Date | Buyer | Sale Price | Title Company |
|---|---|---|---|
| J A Rutelonis Ret 2022 | -- | None Available | |
| Rutelonis Judith | $95,000 | -- |
Source: Public Records
Mortgage History
| Date | Status | Borrower | Loan Amount |
|---|---|---|---|
| Previous Owner | Rutelonis Judith A | $140,000 | |
| Previous Owner | Rutelonis Judith | $130,000 | |
| Previous Owner | Rutelonis Judith | $200,000 | |
| Previous Owner | Rutelonis Judith | $110,000 | |
| Previous Owner | Rutelonis Judith | $55,000 | |
| Previous Owner | Rutelonis Judith | $30,000 | |
| Previous Owner | Rutelonis Judith | $10,000 |
Source: Public Records
Tax History Compared to Growth
Tax History
| Year | Tax Paid | Tax Assessment Tax Assessment Total Assessment is a certain percentage of the fair market value that is determined by local assessors to be the total taxable value of land and additions on the property. | Land | Improvement |
|---|---|---|---|---|
| 2025 | $59 | $414,000 | $113,500 | $300,500 |
| 2024 | $6,114 | $409,500 | $107,700 | $301,800 |
| 2023 | $5,720 | $360,200 | $97,900 | $262,300 |
| 2022 | $5,266 | $313,100 | $97,900 | $215,200 |
| 2021 | $4,477 | $246,800 | $86,400 | $160,400 |
| 2020 | $4,317 | $240,100 | $86,400 | $153,700 |
| 2019 | $4,058 | $220,300 | $85,500 | $134,800 |
| 2018 | $3,836 | $208,000 | $79,900 | $128,100 |
| 2017 | $3,679 | $200,600 | $72,500 | $128,100 |
| 2016 | $3,656 | $202,100 | $75,900 | $126,200 |
| 2015 | $3,440 | $199,300 | $75,900 | $123,400 |
| 2014 | $3,346 | $193,500 | $72,300 | $121,200 |
Source: Public Records
Map
Nearby Homes