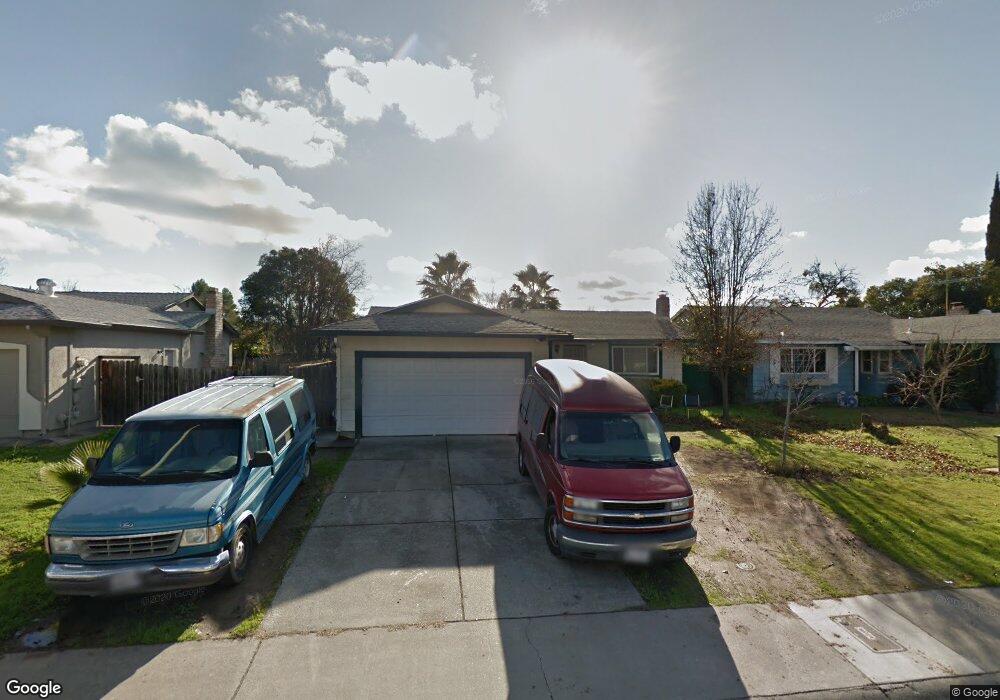
10 Casey Ct Sacramento, CA 95838
Glenwood Meadows NeighborhoodEstimated Value: $232,000 - $451,000
4
Beds
2
Baths
1,307
Sq Ft
$284/Sq Ft
Est. Value
About This Home
This home is located at 10 Casey Ct, Sacramento, CA 95838 and is currently estimated at $371,609, approximately $284 per square foot. 10 Casey Ct is a home located in Sacramento County with nearby schools including Glenwood Elementary School, Rio Linda Preparatory Academy, and Norwood Junior High School.
Ownership History
Date
Name
Owned For
Owner Type
Purchase Details
Closed on
Nov 19, 2008
Sold by
Chand Harish
Bought by
Chand Harish and Chand Shobhna
Current Estimated Value
Purchase Details
Closed on
Nov 18, 2008
Sold by
Chand Shobhna
Bought by
Chand Harish
Purchase Details
Closed on
Nov 12, 2008
Sold by
Barajas Samuel and Moreno Adriana
Bought by
Chand Harish
Purchase Details
Closed on
Oct 2, 2006
Sold by
Haase Martin J and Paredes Sofia M
Bought by
Barajas Samuel and Moreno Adriana
Home Financials for this Owner
Home Financials are based on the most recent Mortgage that was taken out on this home.
Original Mortgage
$220,800
Interest Rate
6.62%
Mortgage Type
Purchase Money Mortgage
Purchase Details
Closed on
Oct 26, 2000
Sold by
Adams James H and Adams Patricia A
Bought by
Haase Martin J and Paredes Sofia M
Home Financials for this Owner
Home Financials are based on the most recent Mortgage that was taken out on this home.
Original Mortgage
$93,000
Interest Rate
7.87%
Create a Home Valuation Report for This Property
The Home Valuation Report is an in-depth analysis detailing your home's value as well as a comparison with similar homes in the area
Home Values in the Area
Average Home Value in this Area
Purchase History
| Date | Buyer | Sale Price | Title Company |
|---|---|---|---|
| Chand Harish | -- | None Available | |
| Chand Harish | -- | Fidelity National Title Co | |
| Chand Harish | $121,000 | Fidelity National Title Co | |
| Barajas Samuel | $276,000 | New Century Title Company | |
| Haase Martin J | $124,000 | Commonwealth Land Title Co |
Source: Public Records
Mortgage History
| Date | Status | Borrower | Loan Amount |
|---|---|---|---|
| Previous Owner | Barajas Samuel | $220,800 | |
| Previous Owner | Haase Martin J | $93,000 |
Source: Public Records
Tax History
| Year | Tax Paid | Tax Assessment Tax Assessment Total Assessment is a certain percentage of the fair market value that is determined by local assessors to be the total taxable value of land and additions on the property. | Land | Improvement |
|---|---|---|---|---|
| 2025 | $2,144 | $155,800 | $70,817 | $84,983 |
| 2024 | $2,144 | $152,746 | $69,429 | $83,317 |
| 2023 | $2,210 | $149,752 | $68,068 | $81,684 |
| 2022 | $2,092 | $146,817 | $66,734 | $80,083 |
| 2021 | $2,089 | $143,939 | $65,426 | $78,513 |
| 2020 | $2,049 | $142,464 | $64,756 | $77,708 |
| 2019 | $2,041 | $139,672 | $63,487 | $76,185 |
| 2018 | $1,898 | $136,935 | $62,243 | $74,692 |
| 2017 | $2,243 | $134,251 | $61,023 | $73,228 |
| 2016 | $1,860 | $131,620 | $59,827 | $71,793 |
| 2015 | $1,723 | $129,644 | $58,929 | $70,715 |
| 2014 | $1,747 | $127,105 | $57,775 | $69,330 |
Source: Public Records
Map
Nearby Homes
- 31 Butterwick Ct
- 4517 Breckenridge Way
- 4528 Austin St
- 4323 Oconner Way
- 0 Bell Ave Unit 226033338
- 213 Arbor Crest Way
- 4279 Englewood St
- 1 Pinache Ct
- 4159 Englewood St
- 114 Pinedale Ave
- 4 Coso Ct
- 4391 Burgess Dr
- 525 Samuel Way
- 541 Samuel Way
- 10 Smokey Leaf Ct
- 4261 Taylor St
- 581 Main Ave
- 7 Morrison Ave
- 782 Crosswind Dr
- 4824 Taylor St
Your Personal Tour Guide
Ask me questions while you tour the home.