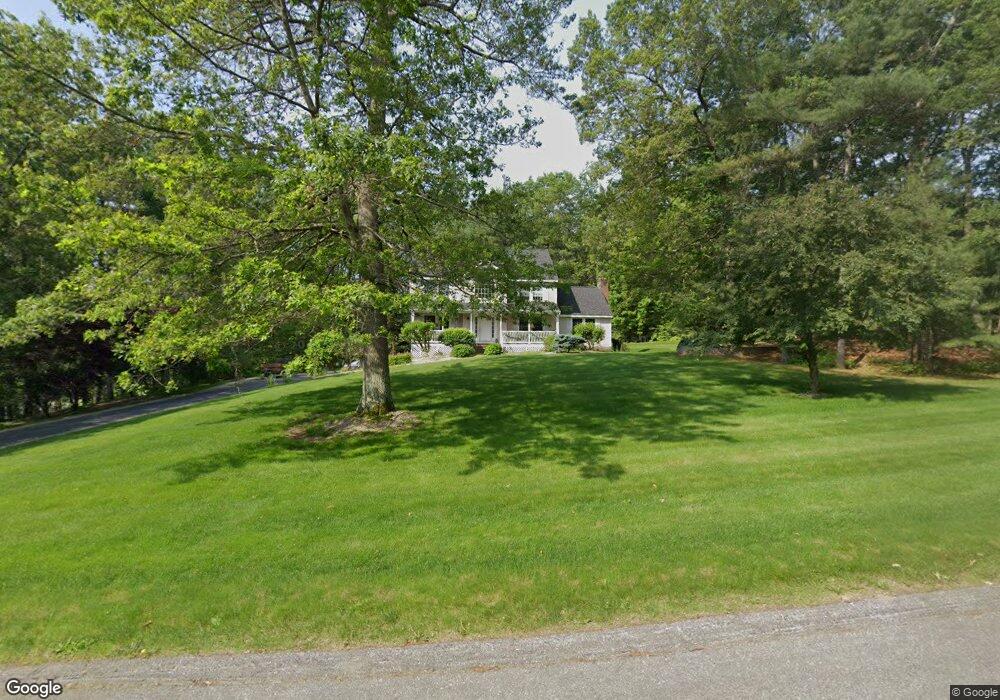
10 Cheshire Ct Londonderry, NH 03053
Estimated Value: $735,000 - $824,000
3
Beds
3
Baths
2,248
Sq Ft
$344/Sq Ft
Est. Value
About This Home
This home is located at 10 Cheshire Ct, Londonderry, NH 03053 and is currently estimated at $772,254, approximately $343 per square foot. 10 Cheshire Ct is a home with nearby schools including Londonderry Middle School and Londonderry Senior High School.
Ownership History
Date
Name
Owned For
Owner Type
Purchase Details
Closed on
Oct 5, 2000
Sold by
Lutz Robert J and Lutz Michelle L
Bought by
Cassidy James
Current Estimated Value
Home Financials for this Owner
Home Financials are based on the most recent Mortgage that was taken out on this home.
Original Mortgage
$228,000
Outstanding Balance
$83,387
Interest Rate
7.96%
Estimated Equity
$688,867
Purchase Details
Closed on
Jan 4, 1999
Sold by
Acme Dev Inc
Bought by
Lutz Robert J and Lutz Michelle L
Home Financials for this Owner
Home Financials are based on the most recent Mortgage that was taken out on this home.
Original Mortgage
$51,600
Interest Rate
6.84%
Create a Home Valuation Report for This Property
The Home Valuation Report is an in-depth analysis detailing your home's value as well as a comparison with similar homes in the area
Home Values in the Area
Average Home Value in this Area
Purchase History
| Date | Buyer | Sale Price | Title Company |
|---|---|---|---|
| Cassidy James | $85,000 | -- | |
| Lutz Robert J | $64,500 | -- |
Source: Public Records
Mortgage History
| Date | Status | Borrower | Loan Amount |
|---|---|---|---|
| Open | Lutz Robert J | $60,000 | |
| Open | Lutz Robert J | $228,000 | |
| Previous Owner | Lutz Robert J | $51,600 |
Source: Public Records
Tax History Compared to Growth
Tax History
| Year | Tax Paid | Tax Assessment Tax Assessment Total Assessment is a certain percentage of the fair market value that is determined by local assessors to be the total taxable value of land and additions on the property. | Land | Improvement |
|---|---|---|---|---|
| 2024 | $10,299 | $638,100 | $243,000 | $395,100 |
| 2023 | $9,986 | $638,100 | $243,000 | $395,100 |
| 2022 | $9,292 | $502,800 | $182,200 | $320,600 |
| 2021 | $9,241 | $502,800 | $182,200 | $320,600 |
| 2020 | $9,753 | $485,000 | $146,000 | $339,000 |
| 2019 | $9,404 | $485,000 | $146,000 | $339,000 |
| 2018 | $9,047 | $415,000 | $122,100 | $292,900 |
| 2017 | $8,968 | $415,000 | $122,100 | $292,900 |
| 2016 | $8,923 | $415,000 | $122,100 | $292,900 |
| 2015 | $8,723 | $415,000 | $122,100 | $292,900 |
| 2014 | $8,752 | $415,000 | $122,100 | $292,900 |
| 2011 | -- | $429,400 | $122,100 | $307,300 |
Source: Public Records
Map
Nearby Homes