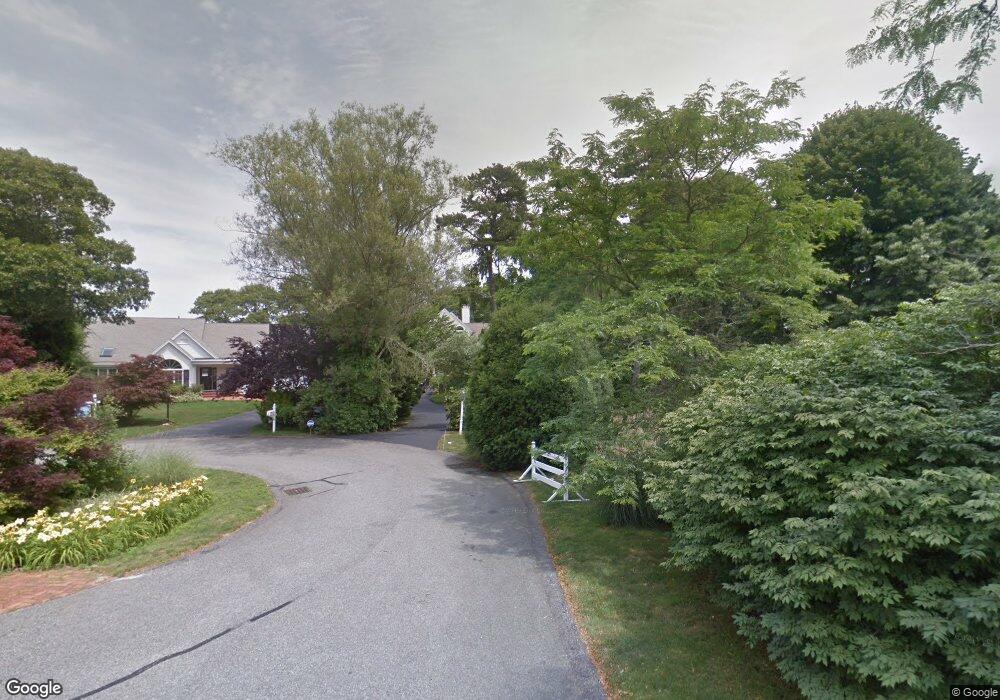
10 Colonial Farm Cir Marstons Mills, MA 02648
Marstons Mills NeighborhoodEstimated Value: $1,198,000 - $1,762,000
5
Beds
4
Baths
3,201
Sq Ft
$432/Sq Ft
Est. Value
About This Home
This home is located at 10 Colonial Farm Cir, Marstons Mills, MA 02648 and is currently estimated at $1,381,621, approximately $431 per square foot. 10 Colonial Farm Cir is a home located in Barnstable County with nearby schools including West Villages Elementary School, Barnstable United Elementary School, and Barnstable Intermediate School.
Ownership History
Date
Name
Owned For
Owner Type
Purchase Details
Closed on
Jul 22, 2021
Sold by
Martin David S and Martin Susan K
Bought by
Martin Nt
Current Estimated Value
Purchase Details
Closed on
Jun 1, 2001
Sold by
Blair Laura E
Bought by
Martin David S
Purchase Details
Closed on
May 21, 1999
Sold by
Troy John F and Troy Judith B
Bought by
Blair Laura Egan
Purchase Details
Closed on
Jun 3, 1996
Sold by
Winklemann Roy and Stevens Judy C
Bought by
Troy John F
Purchase Details
Closed on
Nov 7, 1988
Sold by
Homestead Devt Tr
Bought by
Winkelmann Roy
Home Financials for this Owner
Home Financials are based on the most recent Mortgage that was taken out on this home.
Original Mortgage
$406,700
Interest Rate
10.33%
Mortgage Type
Purchase Money Mortgage
Create a Home Valuation Report for This Property
The Home Valuation Report is an in-depth analysis detailing your home's value as well as a comparison with similar homes in the area
Home Values in the Area
Average Home Value in this Area
Purchase History
| Date | Buyer | Sale Price | Title Company |
|---|---|---|---|
| Martin Nt | -- | None Available | |
| Martin David S | $585,000 | -- | |
| Blair Laura Egan | $425,000 | -- | |
| Troy John F | $400,000 | -- | |
| Winkelmann Roy | $533,000 | -- |
Source: Public Records
Mortgage History
| Date | Status | Borrower | Loan Amount |
|---|---|---|---|
| Previous Owner | Winkelmann Roy | $50,000 | |
| Previous Owner | Winkelmann Roy | $438,000 | |
| Previous Owner | Winkelmann Roy | $406,700 |
Source: Public Records
Tax History Compared to Growth
Tax History
| Year | Tax Paid | Tax Assessment Tax Assessment Total Assessment is a certain percentage of the fair market value that is determined by local assessors to be the total taxable value of land and additions on the property. | Land | Improvement |
|---|---|---|---|---|
| 2025 | $9,499 | $1,174,200 | $338,500 | $835,700 |
| 2024 | $8,831 | $1,130,700 | $338,500 | $792,200 |
| 2023 | $8,509 | $1,020,300 | $314,800 | $705,500 |
| 2022 | $7,915 | $821,100 | $217,600 | $603,500 |
| 2021 | $8,000 | $762,600 | $238,300 | $524,300 |
| 2020 | $8,142 | $742,900 | $238,300 | $504,600 |
| 2019 | $7,887 | $699,200 | $248,700 | $450,500 |
| 2018 | $7,251 | $646,300 | $250,900 | $395,400 |
| 2017 | $6,752 | $627,500 | $250,900 | $376,600 |
| 2016 | $6,856 | $629,000 | $253,000 | $376,000 |
| 2015 | $6,547 | $603,400 | $246,100 | $357,300 |
Source: Public Records
Map
Nearby Homes
- 16 Colonial Farm Cir
- 176 Olde Homestead Dr
- 166 Olde Homestead Dr
- 17 Colonial Farm Cir
- 156 Olde Homestead Dr
- 11 Colonial Farm Cir
- 5 Colonial Farm Cir
- 146 Olde Homestead Dr
- 175 Olde Homestead Dr
- 163 Olde Homestead Dr
- 136 Olde Homestead Dr
- 151 Olde Homestead Dr
- 205 Olde Homestead Dr
- 210 Olde Homestead Dr
- 330 Olde Homestead Dr
- 128 Olde Homestead Dr
- 137 Olde Homestead Dr
- 213 Olde Homestead Dr
- 228 Olde Homestead Dr
- 219 Olde Homestead Dr