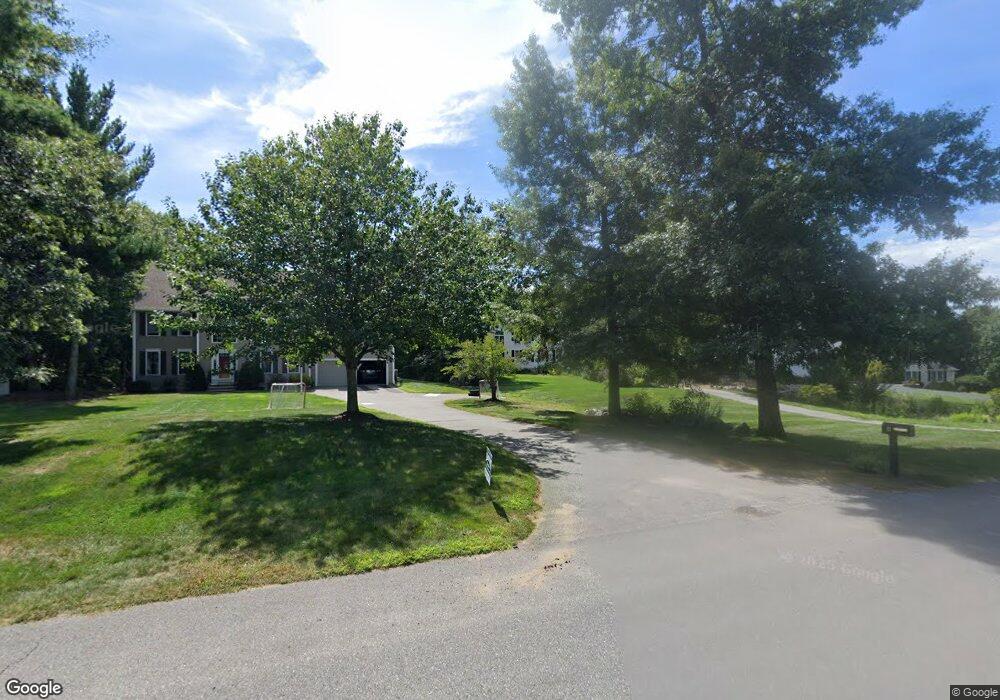
10 Corliss Rd Windham, NH 03087
Estimated Value: $871,000 - $1,035,000
4
Beds
3
Baths
3,153
Sq Ft
$301/Sq Ft
Est. Value
About This Home
This home is located at 10 Corliss Rd, Windham, NH 03087 and is currently estimated at $949,278, approximately $301 per square foot. 10 Corliss Rd is a home located in Rockingham County with nearby schools including Golden Brook Elementary School, Windham Middle School, and Windham High School.
Ownership History
Date
Name
Owned For
Owner Type
Purchase Details
Closed on
Sep 29, 2016
Sold by
Kasprzak Yori J and Kasprzak Andrea L
Bought by
Kasprzak Ft
Current Estimated Value
Purchase Details
Closed on
Nov 22, 2006
Sold by
Unknown
Bought by
Kasprzak Yori J and Kasprzak Andrea L
Home Financials for this Owner
Home Financials are based on the most recent Mortgage that was taken out on this home.
Original Mortgage
$384,000
Interest Rate
6.39%
Mortgage Type
Purchase Money Mortgage
Create a Home Valuation Report for This Property
The Home Valuation Report is an in-depth analysis detailing your home's value as well as a comparison with similar homes in the area
Home Values in the Area
Average Home Value in this Area
Purchase History
| Date | Buyer | Sale Price | Title Company |
|---|---|---|---|
| Kasprzak Ft | -- | -- | |
| Kasprzak Yori J | $480,000 | -- |
Source: Public Records
Mortgage History
| Date | Status | Borrower | Loan Amount |
|---|---|---|---|
| Previous Owner | Kasprzak Yori J | $349,750 | |
| Previous Owner | Kasprzak Yori J | $96,000 | |
| Previous Owner | Kasprzak Yori J | $384,000 |
Source: Public Records
Tax History
| Year | Tax Paid | Tax Assessment Tax Assessment Total Assessment is a certain percentage of the fair market value that is determined by local assessors to be the total taxable value of land and additions on the property. | Land | Improvement |
|---|---|---|---|---|
| 2024 | $12,710 | $561,400 | $185,800 | $375,600 |
| 2023 | $12,014 | $561,400 | $185,800 | $375,600 |
| 2022 | $11,093 | $561,400 | $185,800 | $375,600 |
| 2021 | $10,178 | $546,600 | $185,800 | $360,800 |
| 2020 | $10,456 | $546,600 | $185,800 | $360,800 |
| 2019 | $10,308 | $457,100 | $156,900 | $300,200 |
| 2018 | $10,646 | $457,100 | $156,900 | $300,200 |
| 2017 | $9,233 | $457,100 | $156,900 | $300,200 |
| 2016 | $9,974 | $457,100 | $156,900 | $300,200 |
| 2015 | $9,928 | $457,100 | $156,900 | $300,200 |
| 2014 | $8,909 | $371,200 | $151,000 | $220,200 |
| 2013 | $9,423 | $399,300 | $151,000 | $248,300 |
Source: Public Records
Map
Nearby Homes
- 47 Campbell St
- 9A Winter St
- 47 Cobbetts Pond Rd
- 6-18 Mary Anthony Dr
- 210 Range Rd
- 30 Winter St
- 56 Nelson St
- 4 Rosemary St
- 18 Winter St
- 108 S Shore Rd
- 92 Lowell Rd
- 3 Kennedy Dr
- 5 Johnson St
- 11 Wellesley Dr
- 6 Chadwick Cir
- Lot 4 Canterbury Rd Unit 4
- 54 Enterprise Dr
- 16 Carmel Rd Unit M18 B12-16 L2
- 75 S Policy St Unit 45
- 6 Newbury Rd
Your Personal Tour Guide
Ask me questions while you tour the home.