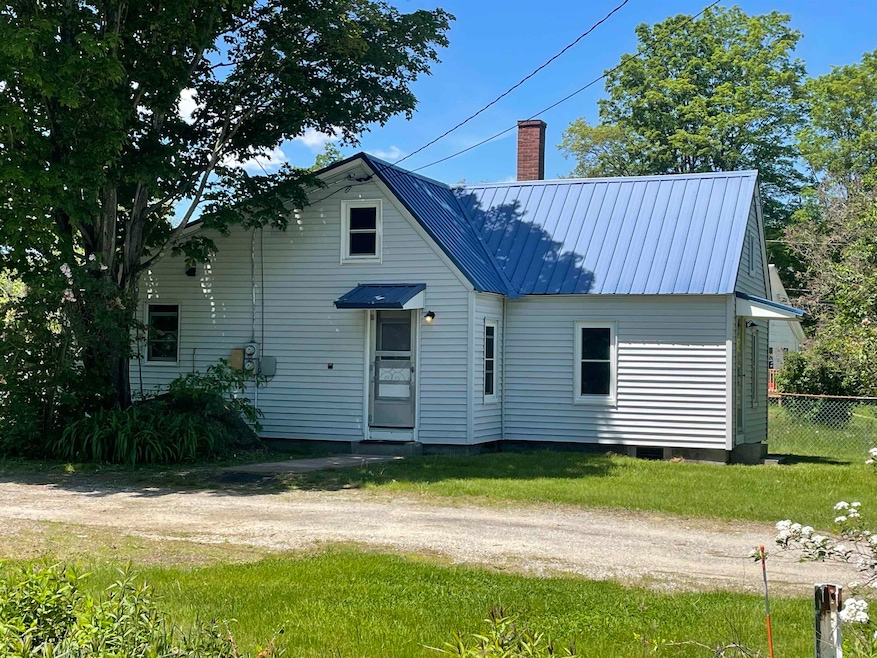
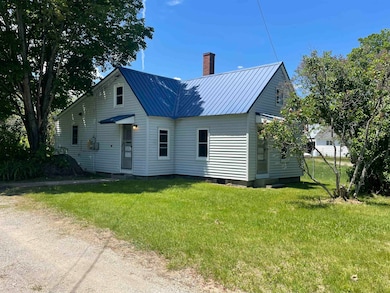
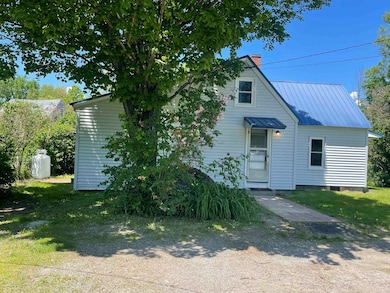
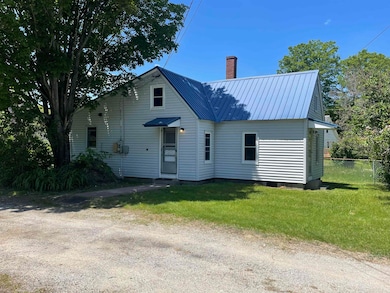
10 Deering Center Rd Deering, NH 03244
Estimated payment $1,905/month
Highlights
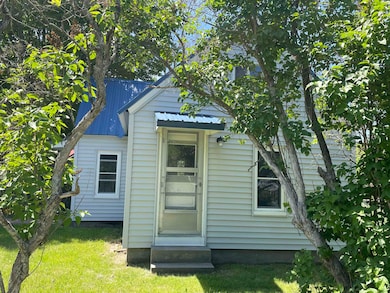
- Cape Cod Architecture
- High Speed Internet
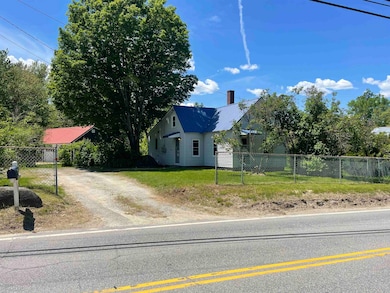
- Level Lot
- Forced Air Heating System
About This Home
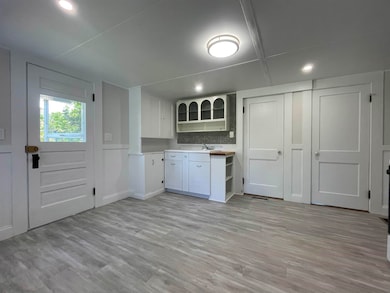
*****New Septic being installed***** in this cozy 2-bedroom home in the quaint town of Deering, just over the border of Hillsborough. This home has been completely renovated and is bright and airy. Minutes from downtown Hillsborough for Shopping, Restaurants, Golf, and more. Only 10 miles to Pats Peak ski area, and only 16 miles to Sunapee ski area, great location for whatever you want to do. Easy commute to Concord, Manchester, Keene or Lebanon. New water heater, new FHA furnace, new refrigerator, new septic, town water, this may as well be a new construction family home. *
Original home was built in the 1920, with an addition added approximately 30 years ago, but looks to be built last month.
Home Details
Home Type
- Single Family
Est. Annual Taxes
- $3,889
Year Built
- Built in 1927
Lot Details
- 5,663 Sq Ft Lot
- Level Lot
Parking
- Gravel Driveway
Home Design
- Cape Cod Architecture
- Concrete Foundation
- Metal Roof
- Vinyl Siding
Interior Spaces
- 869 Sq Ft Home
- Property has 1 Level
Bedrooms and Bathrooms
- 2 Bedrooms
- 1 Full Bathroom
Outdoor Features
- Electricity Available at Street
Utilities
- Forced Air Heating System
- High Speed Internet
Listing and Financial Details
- Tax Lot 11
- Assessor Parcel Number 206
Map
Home Values in the Area
Average Home Value in this Area
Tax History
| Year | Tax Paid | Tax Assessment Tax Assessment Total Assessment is a certain percentage of the fair market value that is determined by local assessors to be the total taxable value of land and additions on the property. | Land | Improvement |
|---|---|---|---|---|
| 2024 | $3,889 | $138,400 | $63,900 | $74,500 |
| 2023 | $3,596 | $138,400 | $63,900 | $74,500 |
| 2022 | $3,149 | $138,400 | $63,900 | $74,500 |
| 2021 | $3,122 | $138,400 | $63,900 | $74,500 |
| 2020 | $3,431 | $138,300 | $63,900 | $74,400 |
| 2019 | $7,967 | $83,700 | $28,900 | $54,800 |
| 2018 | $7,708 | $83,700 | $28,900 | $54,800 |
| 2017 | $2,508 | $83,700 | $28,900 | $54,800 |
| 2016 | $2,390 | $83,700 | $28,900 | $54,800 |
| 2015 | $2,475 | $83,700 | $28,900 | $54,800 |
| 2014 | $2,339 | $94,800 | $31,500 | $63,300 |
| 2013 | $2,460 | $94,800 | $31,500 | $63,300 |
Property History
| Date | Event | Price | List to Sale | Price per Sq Ft |
|---|---|---|---|---|
| 10/29/2025 10/29/25 | Price Changed | $299,900 | -4.8% | $345 / Sq Ft |
| 10/03/2025 10/03/25 | For Sale | $315,000 | -- | $362 / Sq Ft |
Purchase History
| Date | Type | Sale Price | Title Company |
|---|---|---|---|
| Quit Claim Deed | -- | -- | |
| Warranty Deed | -- | -- |
Source: PrimeMLS
MLS Number: 5064266
APN: DRNG-000206-000011
Disclaimer: Certain information contained herein is derived from information provided by parties other than Homes.com. All information provided is deemed reliable, but is not guaranteed to be accurate and should be independently verified.
![]() Copyright 2025 PrimeMLS, Inc. All rights reserved. This information is deemed reliable, but not guaranteed. The data relating to real estate displayed on this display comes in part from the IDX Program of PrimeMLS. The information being provided is for consumers’ personal, non-commercial use and may not be used for any purpose other than to identify prospective properties consumers may be interested in purchasing.
Copyright 2025 PrimeMLS, Inc. All rights reserved. This information is deemed reliable, but not guaranteed. The data relating to real estate displayed on this display comes in part from the IDX Program of PrimeMLS. The information being provided is for consumers’ personal, non-commercial use and may not be used for any purpose other than to identify prospective properties consumers may be interested in purchasing.
- 32 Union St
- 86 Manselville Rd
- 88 W Mill St
- 120 Deering Center Rd
- 73 W Main St
- 1 W Main St
- 20-22 Church St
- 21 School St
- 77 Henniker St
- 31 Woodlawn Ave
- 31 Central St Unit G
- 82 Church St
- 25 Wyman Rd Unit 68
- 9 Wyman Rd
- 4 Chamberlain Ct
- 21 Wyman Rd
- 212 W Main St
- 34 Old Henniker Rd
- 0 W Main St Unit 1
- 00 Rochester Rd Unit 32
- 16 Preston St Unit 1A
- 2337 2nd Nh Turnpike
- 867 Quaker St
- 119 Keene Rd Unit 2
- 119 Keene Rd Unit 5
- 436 Western Ave Unit Apartment 3
- 95 Hall Ave Unit B2-C
- 95 Hall Ave Unit B2-C
- 111 Gregg Lake Rd
- 86 Reservoir Dr
- 78 North Rd
- 291 French Pond Rd
- 7 Bennington Rd Unit 2
- 7 Bennington Rd Unit main 1
- 31 Water St
- 31 Water St Unit 5
- 83 W Main St
- 115 High Rock Rd Unit A
- 69 Putney Hill Rd Unit The East Wing
- 163 Gould Hill Rd Unit A
