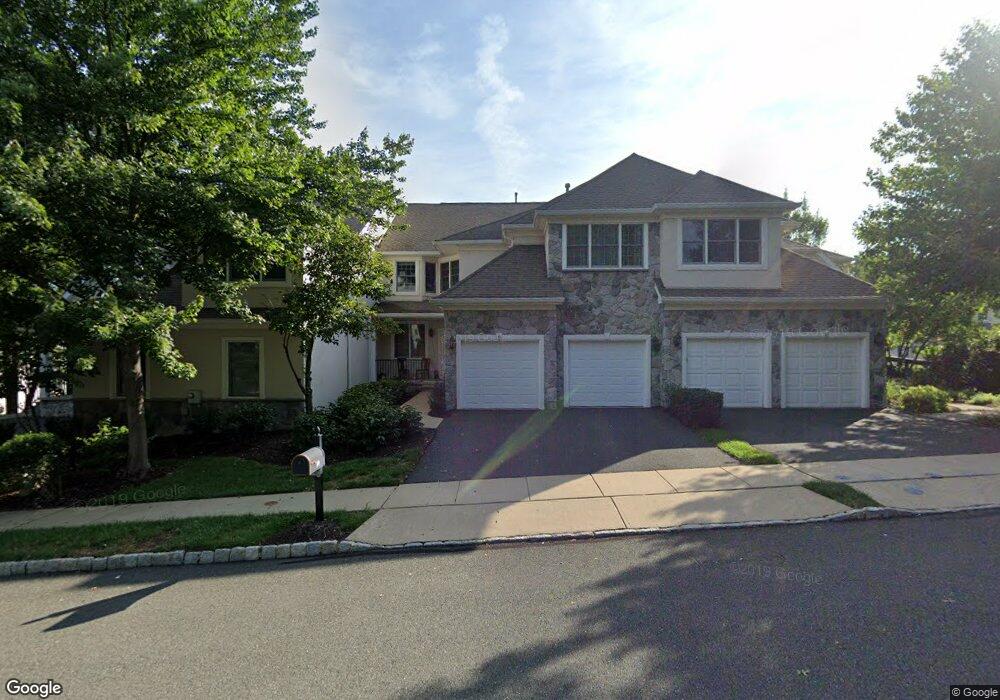
10 Dickinson Rd Basking Ridge, NJ 07920
Estimated Value: $969,802 - $1,120,000
--
Bed
--
Bath
2,711
Sq Ft
$390/Sq Ft
Est. Value
About This Home
This home is located at 10 Dickinson Rd, Basking Ridge, NJ 07920 and is currently estimated at $1,056,451, approximately $389 per square foot. 10 Dickinson Rd is a home located in Somerset County with nearby schools including Mount Prospect Elementary School, William Annin Middle School, and Ridge High School.
Ownership History
Date
Name
Owned For
Owner Type
Purchase Details
Closed on
Dec 16, 2022
Sold by
Ramasubramanian Hariharan
Bought by
Ramasubramanian Hariharan and Natarajan Lakshmi
Current Estimated Value
Purchase Details
Closed on
Jun 27, 2011
Sold by
Handsman Mark
Bought by
Ramasubramanian Harharan
Home Financials for this Owner
Home Financials are based on the most recent Mortgage that was taken out on this home.
Original Mortgage
$543,000
Interest Rate
3.25%
Mortgage Type
Adjustable Rate Mortgage/ARM
Purchase Details
Closed on
Jul 7, 2009
Sold by
Hoffman William K and Hoffman Carolyn W
Bought by
Handsman Mark
Home Financials for this Owner
Home Financials are based on the most recent Mortgage that was taken out on this home.
Original Mortgage
$300,000
Interest Rate
5.36%
Mortgage Type
Purchase Money Mortgage
Purchase Details
Closed on
May 1, 1998
Sold by
Hills Development Co
Bought by
Hoffman William K and Hoffman Carolyn W
Create a Home Valuation Report for This Property
The Home Valuation Report is an in-depth analysis detailing your home's value as well as a comparison with similar homes in the area
Home Values in the Area
Average Home Value in this Area
Purchase History
| Date | Buyer | Sale Price | Title Company |
|---|---|---|---|
| Ramasubramanian Hariharan | -- | -- | |
| Ramasubramanian Harharan | $725,000 | Chicago Title Insurance Co | |
| Handsman Mark | $695,000 | Multiple | |
| Hoffman William K | $379,000 | -- |
Source: Public Records
Mortgage History
| Date | Status | Borrower | Loan Amount |
|---|---|---|---|
| Previous Owner | Ramasubramanian Harharan | $543,000 | |
| Previous Owner | Handsman Mark | $300,000 |
Source: Public Records
Tax History Compared to Growth
Tax History
| Year | Tax Paid | Tax Assessment Tax Assessment Total Assessment is a certain percentage of the fair market value that is determined by local assessors to be the total taxable value of land and additions on the property. | Land | Improvement |
|---|---|---|---|---|
| 2025 | $13,812 | $888,100 | $295,500 | $592,600 |
| 2024 | $13,812 | $776,400 | $258,400 | $518,000 |
| 2023 | $14,264 | $756,300 | $258,400 | $497,900 |
| 2022 | $14,602 | $726,100 | $258,400 | $467,700 |
| 2021 | $14,688 | $696,100 | $259,400 | $436,700 |
| 2020 | $14,819 | $707,700 | $278,000 | $429,700 |
| 2019 | $14,759 | $725,600 | $278,000 | $447,600 |
| 2018 | $14,572 | $726,800 | $278,000 | $448,800 |
| 2017 | $14,561 | $732,100 | $278,000 | $454,100 |
| 2016 | $14,389 | $737,500 | $278,000 | $459,500 |
| 2015 | $14,424 | $752,800 | $288,000 | $464,800 |
| 2014 | $14,085 | $728,300 | $288,000 | $440,300 |
Source: Public Records
Map
Nearby Homes
- 41 Dickinson Rd
- 14 Hadley Ct
- 32 Mayflower Dr Unit E1
- 23 Hansom Rd
- 12 Hansom Rd
- 4 Hansom Rd
- 25 Stevens Ct
- 10 Morgan Ct
- 22 Morgan Ct
- 39 Academy Ct
- 14 Sussex Ct
- 49 Liberty Corner Rd
- 971 Washington Valley Rd
- 19 Gatehouse Rd
- 2 Berkley Ln
- 167 Douglas Rd
- 25 Spruce Ct
- 46 Eton Ct
- 15 Ray Ct
- 6 Ray Ct Unit 13706
- 12 Dickinson Rd
- 8 Dickinson Rd
- 6 Dickinson Rd
- 28 Dickinson Rd
- 4 Benedict Crescent
- 2 Benedict Crescent
- 4 Dickinson Rd
- 7 Barton Way
- 19 Dickinson Rd
- 17 Dickinson Rd
- 6 Benedict Crescent
- 21 Dickinson Rd
- 5 Barton Way
- 15 Dickinson Rd
- 2 Dickinson Rd
- 23 Dickinson Rd
- 8 Benedict Crescent
- 3 Barton Way
- 10 Benedict Crescent
- 25 Dickinson Rd