Estimated Value: $357,000 - $396,000
2
Beds
2
Baths
1,632
Sq Ft
$230/Sq Ft
Est. Value
About This Home
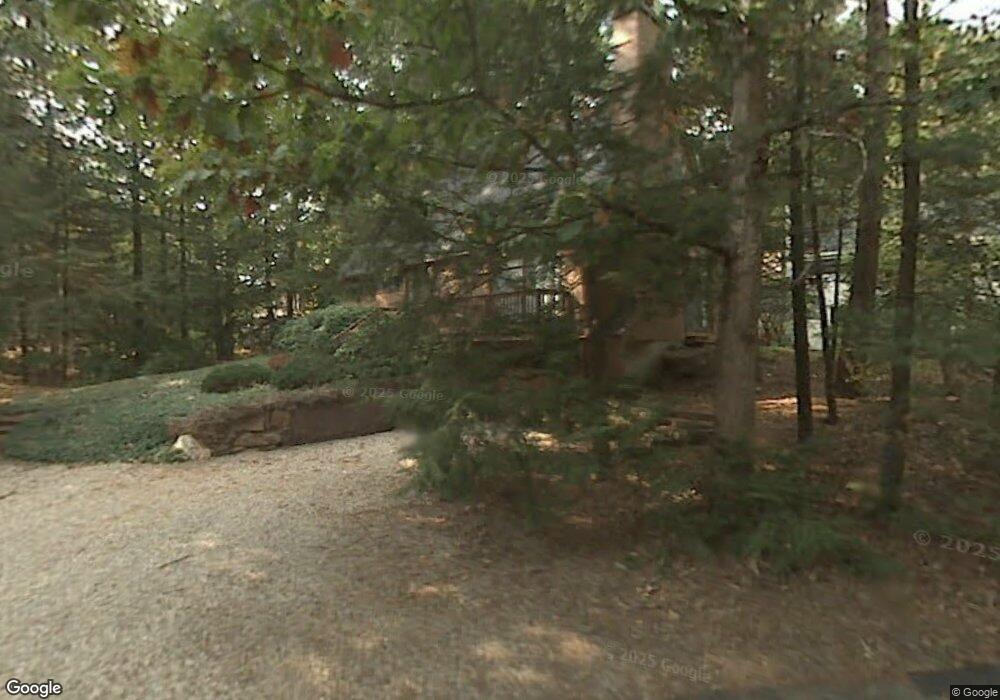
This home is located at 10 Dove Cir, Avon, CT 06001 and is currently estimated at $376,041, approximately $230 per square foot. 10 Dove Cir is a home located in Hartford County with nearby schools including Thompson Brook School, Pine Grove School, and Avon Middle School.
Ownership History
Date
Name
Owned For
Owner Type
Purchase Details
Closed on
Jul 16, 2019
Sold by
Valerie J Patterson T
Bought by
Tullock Ian S and Campbell Teresa J
Current Estimated Value
Home Financials for this Owner
Home Financials are based on the most recent Mortgage that was taken out on this home.
Original Mortgage
$175,200
Interest Rate
3.6%
Mortgage Type
Purchase Money Mortgage
Purchase Details
Closed on
Feb 7, 2014
Sold by
Patterson Valerie J
Bought by
Valerie J Patterson T J and Valerie Patterson
Purchase Details
Closed on
Apr 26, 2010
Sold by
Levick Diane G
Bought by
Patterson Valerie J
Home Financials for this Owner
Home Financials are based on the most recent Mortgage that was taken out on this home.
Original Mortgage
$202,955
Interest Rate
5.25%
Mortgage Type
FHA
Purchase Details
Closed on
Jan 8, 1990
Sold by
Armington Donald
Bought by
Levick Diane
Create a Home Valuation Report for This Property
The Home Valuation Report is an in-depth analysis detailing your home's value as well as a comparison with similar homes in the area
Home Values in the Area
Average Home Value in this Area
Purchase History
| Date | Buyer | Sale Price | Title Company |
|---|---|---|---|
| Tullock Ian S | $219,000 | -- | |
| Tullock Ian S | $219,000 | -- | |
| Valerie J Patterson T J | -- | -- | |
| Valerie J Patterson T | -- | -- | |
| Patterson Valerie J | $206,700 | -- | |
| Patterson Valerie J | $206,700 | -- | |
| Levick Diane | $162,500 | -- |
Source: Public Records
Mortgage History
| Date | Status | Borrower | Loan Amount |
|---|---|---|---|
| Previous Owner | Tullock Ian S | $175,200 | |
| Previous Owner | Levick Diane | $202,955 | |
| Previous Owner | Levick Diane | $96,000 |
Source: Public Records
Tax History
| Year | Tax Paid | Tax Assessment Tax Assessment Total Assessment is a certain percentage of the fair market value that is determined by local assessors to be the total taxable value of land and additions on the property. | Land | Improvement |
|---|---|---|---|---|
| 2025 | $6,200 | $201,640 | $0 | $201,640 |
| 2024 | $5,981 | $201,640 | $0 | $201,640 |
| 2023 | $5,102 | $144,170 | $0 | $144,170 |
| 2022 | $4,990 | $144,170 | $0 | $144,170 |
| 2021 | $4,932 | $144,170 | $0 | $144,170 |
| 2020 | $4,743 | $144,170 | $0 | $144,170 |
| 2019 | $4,743 | $144,170 | $0 | $144,170 |
| 2018 | $4,699 | $149,880 | $0 | $149,880 |
| 2017 | $4,585 | $149,880 | $0 | $149,880 |
| 2016 | $4,424 | $149,880 | $0 | $149,880 |
| 2015 | $4,317 | $149,880 | $0 | $149,880 |
| 2014 | $4,245 | $149,880 | $0 | $149,880 |
Source: Public Records
Map
Nearby Homes
- 19 Jackson St
- 90 Jackson St
- 187 W Avon Rd
- 24 Hendricks Ln
- 239 Old Farms Rd Unit 7C
- 239 Old Farms Rd Unit 15C
- 239 Old Farms Rd Unit 5C
- 125 Country Club Rd
- 13 Hopmeadow St
- 30 Cliff Dr
- 24 Ichabod Rd
- 26 Forest Ln
- 59 Lord Davis Ln
- 189 W Avon Rd
- 185 W Avon Rd
- 21 Lakeview Blvd
- 134 Old Mill Rd
- 100 Nod Way
- 102 Cold Spring Rd
- 10 Old Meadow Way
- 10 Dove Cir Unit 10
- 9 Dove Cir
- 1 Edgewood Cir
- 3 Edgewood Cir
- 3 Edgewood Cir Unit 145
- 3 Edgewood Cir Unit 3
- 4 Edgewood Cir
- 4 Edgewood Cir Unit 4
- 2 Edgewood Cir
- 1 Dove Cir
- 2 Dove Cir
- 5 Morningside Ct
- 4 Morningside Ct
- 8 Dove Cir
- 8 Dove Cir Unit 8
- 5 Edgewood Cir
- 5 Edgewood Cir Unit 5
- 6 Morningside Ct
- 6 Morningside Ct Unit 6
- 3 Dove Cir
Your Personal Tour Guide
Ask me questions while you tour the home.