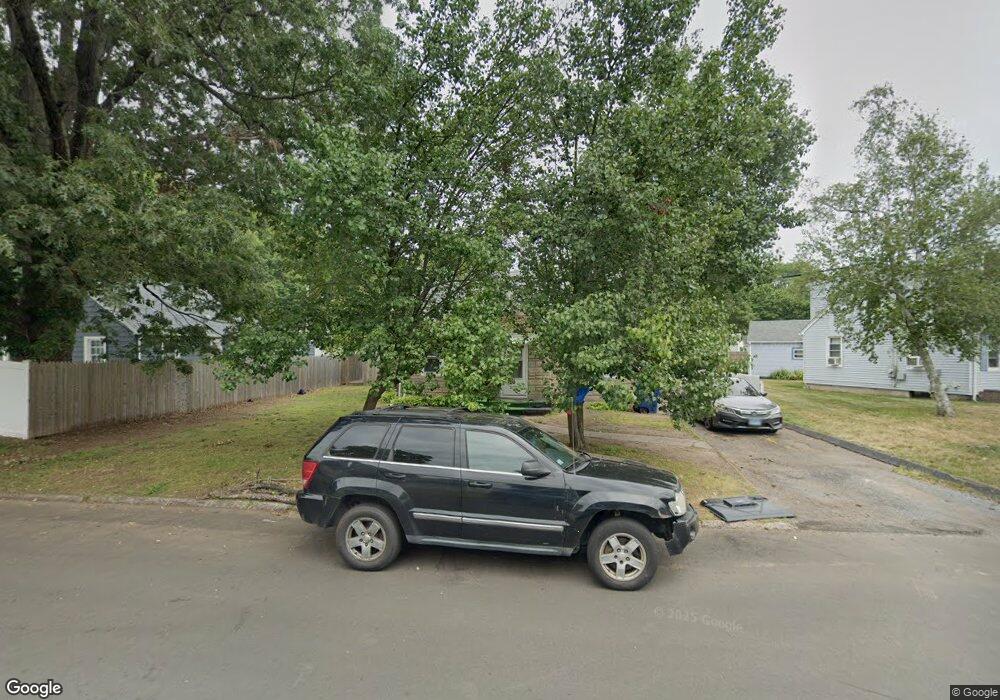
10 Emily Rd New Haven, CT 06513
Quinnipiac Meadows NeighborhoodEstimated Value: $186,000 - $303,000
3
Beds
2
Baths
1,112
Sq Ft
$235/Sq Ft
Est. Value
About This Home
This home is located at 10 Emily Rd, New Haven, CT 06513 and is currently estimated at $261,163, approximately $234 per square foot. 10 Emily Rd is a home located in New Haven County with nearby schools including Bishop Woods Architecture and Design Magnet School, St Francis & St Rose Of Lima School, and All Nations Christian Academy.
Ownership History
Date
Name
Owned For
Owner Type
Purchase Details
Closed on
Feb 8, 2024
Sold by
Prendergast Marc A
Bought by
Colon Joshua and Prendergast Marc A
Current Estimated Value
Home Financials for this Owner
Home Financials are based on the most recent Mortgage that was taken out on this home.
Original Mortgage
$147,283
Interest Rate
7.29%
Mortgage Type
FHA
Purchase Details
Closed on
Jan 5, 2024
Sold by
Martinez Cruz and Martinez Elizabeth C
Bought by
Prendergast Marc A
Home Financials for this Owner
Home Financials are based on the most recent Mortgage that was taken out on this home.
Original Mortgage
$147,283
Interest Rate
7.29%
Mortgage Type
FHA
Purchase Details
Closed on
Jun 29, 1994
Sold by
Assoc Fncl Svc America
Bought by
Martinez Cruz and Martinez Elizabeth C
Create a Home Valuation Report for This Property
The Home Valuation Report is an in-depth analysis detailing your home's value as well as a comparison with similar homes in the area
Home Values in the Area
Average Home Value in this Area
Purchase History
| Date | Buyer | Sale Price | Title Company |
|---|---|---|---|
| Colon Joshua | -- | None Available | |
| Prendergast Marc A | $150,000 | None Available | |
| Martinez Cruz | $85,000 | -- |
Source: Public Records
Mortgage History
| Date | Status | Borrower | Loan Amount |
|---|---|---|---|
| Previous Owner | Prendergast Marc A | $147,283 | |
| Previous Owner | Martinez Cruz | $138,109 | |
| Previous Owner | Martinez Cruz | $10,100 | |
| Previous Owner | Martinez Cruz | $123,250 |
Source: Public Records
Tax History Compared to Growth
Tax History
| Year | Tax Paid | Tax Assessment Tax Assessment Total Assessment is a certain percentage of the fair market value that is determined by local assessors to be the total taxable value of land and additions on the property. | Land | Improvement |
|---|---|---|---|---|
| 2025 | $4,973 | $126,210 | $39,060 | $87,150 |
| 2024 | $4,859 | $126,210 | $39,060 | $87,150 |
| 2023 | $4,695 | $126,210 | $39,060 | $87,150 |
| 2022 | $5,017 | $126,210 | $39,060 | $87,150 |
| 2021 | $4,168 | $94,990 | $26,810 | $68,180 |
| 2020 | $4,061 | $92,540 | $26,810 | $65,730 |
| 2019 | $3,977 | $92,540 | $26,810 | $65,730 |
| 2018 | $3,977 | $92,540 | $26,810 | $65,730 |
| 2017 | $3,579 | $92,540 | $26,810 | $65,730 |
| 2016 | $3,752 | $90,300 | $26,810 | $63,490 |
| 2015 | $3,752 | $90,300 | $26,810 | $63,490 |
| 2014 | $3,752 | $90,300 | $26,810 | $63,490 |
Source: Public Records
Map
Nearby Homes
- 15 Donna Dr Unit A1
- 40 Donna Dr Unit C2
- 1423 Quinnipiac Ave Unit 115
- 1423 Quinnipiac Ave Unit 808
- 1423 Quinnipiac Ave Unit 709
- 1423 Quinnipiac Ave Unit 108
- 1423 Quinnipiac Ave Unit 602
- 1445 Quinnipiac Ave
- 466 Middletown Ave Unit 8
- 175 Weybosset St
- 560 Middletown Ave
- 290 Eastern St
- 90 Foxon Blvd
- 926 Quinnipiac Ave Unit 1
- 926 Quinnipiac Ave Unit 8
- 15 Glen Haven Rd
- 932 Quinnipiac Ave Unit 5
- 66 John St
- 24 Laura Cir
- 916 Quinnipiac Ave Unit 2