10 Eva St San Rafael, CA 94901
Picnic Valley NeighborhoodEstimated Value: $997,000 - $1,273,850
4
Beds
2
Baths
2,172
Sq Ft
$514/Sq Ft
Est. Value
About This Home
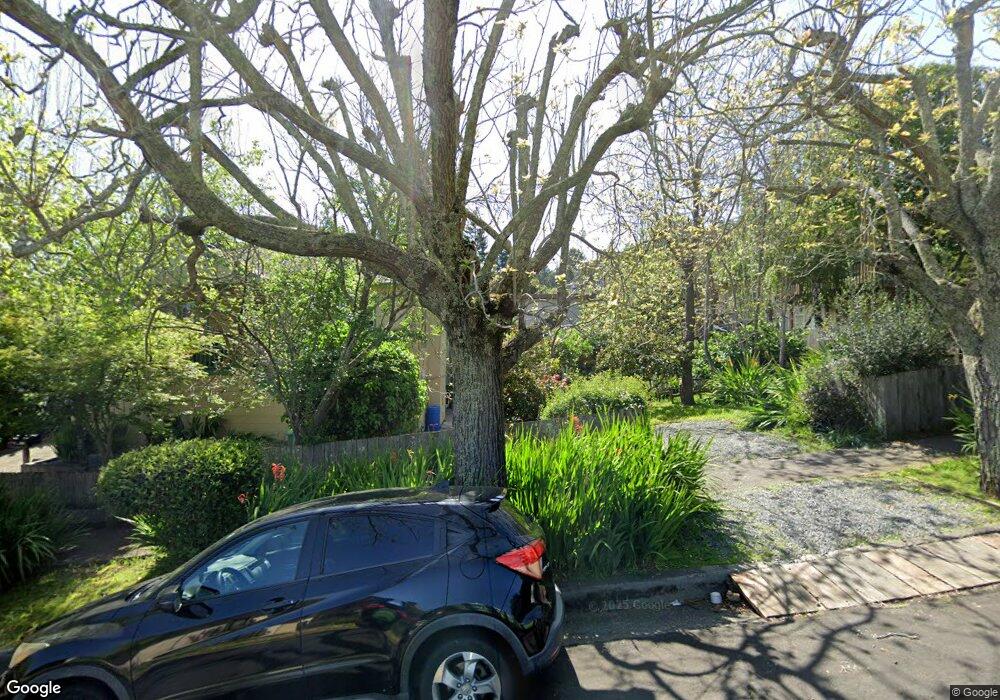
This home is located at 10 Eva St, San Rafael, CA 94901 and is currently estimated at $1,115,963, approximately $513 per square foot. 10 Eva St is a home located in Marin County with nearby schools including Laurel Dell Elementary School, James B. Davidson Middle School, and San Rafael High School.
Ownership History
Date
Name
Owned For
Owner Type
Purchase Details
Closed on
Apr 14, 2016
Sold by
Neill John H O and Neill Renee G O
Bought by
John H And Renee G O Neill 1999 Family T and Neill Renee G O
Current Estimated Value
Home Financials for this Owner
Home Financials are based on the most recent Mortgage that was taken out on this home.
Original Mortgage
$533,850
Outstanding Balance
$423,660
Interest Rate
3.73%
Mortgage Type
New Conventional
Estimated Equity
$692,303
Purchase Details
Closed on
Apr 11, 2016
Sold by
Grant Richard J
Bought by
Grant Colleen M
Home Financials for this Owner
Home Financials are based on the most recent Mortgage that was taken out on this home.
Original Mortgage
$533,850
Outstanding Balance
$423,660
Interest Rate
3.73%
Mortgage Type
New Conventional
Estimated Equity
$692,303
Purchase Details
Closed on
Mar 18, 2016
Sold by
Banion Kelvin R O
Bought by
Banion Christiane T O
Home Financials for this Owner
Home Financials are based on the most recent Mortgage that was taken out on this home.
Original Mortgage
$533,850
Outstanding Balance
$423,660
Interest Rate
3.73%
Mortgage Type
New Conventional
Estimated Equity
$692,303
Purchase Details
Closed on
Mar 8, 2016
Sold by
Legnitto Robert F
Bought by
Legnitto Suzanne L
Home Financials for this Owner
Home Financials are based on the most recent Mortgage that was taken out on this home.
Original Mortgage
$533,850
Outstanding Balance
$423,660
Interest Rate
3.73%
Mortgage Type
New Conventional
Estimated Equity
$692,303
Purchase Details
Closed on
Aug 10, 2015
Sold by
Neill John H O and Legnitto Suzanne L
Bought by
Neill John H O and Neill Renee G O
Home Financials for this Owner
Home Financials are based on the most recent Mortgage that was taken out on this home.
Original Mortgage
$533,850
Interest Rate
3.73%
Mortgage Type
New Conventional
Purchase Details
Closed on
Jan 7, 1993
Sold by
Oneill Ann Geraldine
Bought by
Gracia Shauna M and Oneill John
Purchase Details
Closed on
Jan 2, 1991
Sold by
Oneill Geraldine
Bought by
Gracia Shauna M and Oneill John H
Purchase Details
Closed on
Dec 31, 1990
Sold by
Oneill Geraldine
Bought by
Gracia Shuana M and Oneill John H
Create a Home Valuation Report for This Property
The Home Valuation Report is an in-depth analysis detailing your home's value as well as a comparison with similar homes in the area
Home Values in the Area
Average Home Value in this Area
Purchase History
| Date | Buyer | Sale Price | Title Company |
|---|---|---|---|
| John H And Renee G O Neill 1999 Family T | -- | Old Republic Title Company | |
| Grant Colleen M | -- | Old Republic Title Company | |
| Banion Christiane T O | -- | Old Republic Title Company | |
| Legnitto Suzanne L | -- | Old Republic Title Company | |
| Neill John H O | $670,000 | Old Republic Title Company | |
| Gracia Shauna Oneill | -- | None Available | |
| Gracia Shauna M | -- | -- | |
| Gracia Shauna M | -- | -- | |
| Gracia Shuana M | -- | -- |
Source: Public Records
Mortgage History
| Date | Status | Borrower | Loan Amount |
|---|---|---|---|
| Open | Banion Christiane T O | $533,850 | |
| Closed | Legnitto Suzanne L | $533,850 | |
| Previous Owner | Neill John H O | $533,850 |
Source: Public Records
Tax History Compared to Growth
Tax History
| Year | Tax Paid | Tax Assessment Tax Assessment Total Assessment is a certain percentage of the fair market value that is determined by local assessors to be the total taxable value of land and additions on the property. | Land | Improvement |
|---|---|---|---|---|
| 2025 | $11,754 | $717,624 | $353,671 | $363,953 |
| 2024 | $11,754 | $703,554 | $346,737 | $356,817 |
| 2023 | $11,442 | $689,763 | $339,940 | $349,823 |
| 2022 | $10,892 | $676,237 | $333,274 | $342,963 |
| 2021 | $10,730 | $662,979 | $326,740 | $336,239 |
| 2020 | $10,618 | $656,183 | $323,391 | $332,792 |
| 2019 | $10,210 | $643,319 | $317,051 | $326,268 |
| 2018 | $10,118 | $630,710 | $310,837 | $319,873 |
| 2017 | $9,778 | $618,343 | $304,742 | $313,601 |
| 2016 | $5,794 | $287,389 | $92,650 | $194,739 |
| 2015 | $5,548 | $283,073 | $91,259 | $191,814 |
| 2014 | $5,271 | $277,528 | $89,471 | $188,057 |
Source: Public Records
Map
Nearby Homes