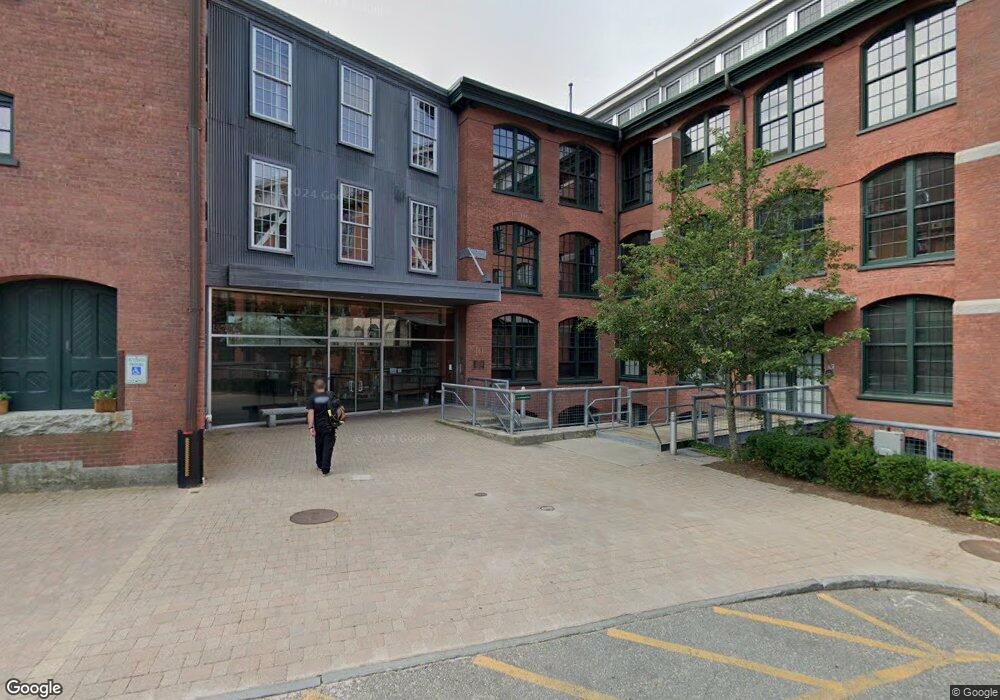
Riverfront Lofts 10 Exchange Ct Unit 509 Pawtucket, RI 02860
Downtown Pawtucket NeighborhoodEstimated Value: $406,000 - $466,432
2
Beds
2
Baths
2,000
Sq Ft
$220/Sq Ft
Est. Value
About This Home
This home is located at 10 Exchange Ct Unit 509, Pawtucket, RI 02860 and is currently estimated at $439,358, approximately $219 per square foot. 10 Exchange Ct Unit 509 is a home located in Providence County with nearby schools including International Charter School, Blackstone Academy Charter School, and Saint Raphael Academy.
Ownership History
Date
Name
Owned For
Owner Type
Purchase Details
Closed on
Jul 30, 2024
Sold by
Myers Kim G
Bought by
Myers Kim G and Myers Amanda K
Current Estimated Value
Purchase Details
Closed on
Nov 25, 2009
Sold by
Bright Robert L and Bright Anne P
Bought by
Myers Kim G
Home Financials for this Owner
Home Financials are based on the most recent Mortgage that was taken out on this home.
Original Mortgage
$235,653
Interest Rate
4.92%
Mortgage Type
Purchase Money Mortgage
Purchase Details
Closed on
Jun 3, 2008
Sold by
Wachovia Mortgage Fsb
Bought by
Bright Robert L and Bright Anne P
Purchase Details
Closed on
Oct 23, 2007
Sold by
Bento Amy L and Bento William F
Bought by
World Sb
Purchase Details
Closed on
May 18, 2007
Sold by
Bento William
Bought by
Riverfront Lofts Assoc
Purchase Details
Closed on
May 20, 2005
Sold by
Blackstone Exchange Ll
Bought by
Bento William F and Bento Amy L
Create a Home Valuation Report for This Property
The Home Valuation Report is an in-depth analysis detailing your home's value as well as a comparison with similar homes in the area
Home Values in the Area
Average Home Value in this Area
Purchase History
| Date | Buyer | Sale Price | Title Company |
|---|---|---|---|
| Myers Kim G | -- | None Available | |
| Myers Kim G | -- | None Available | |
| Myers Kim G | $240,000 | -- | |
| Myers Kim G | $240,000 | -- | |
| Bright Robert L | $150,000 | -- | |
| Bright Robert L | $150,000 | -- | |
| World Sb | $294,750 | -- | |
| World Sb | $294,750 | -- | |
| Riverfront Lofts Assoc | $1,000 | -- | |
| Riverfront Lofts Assoc | $1,000 | -- | |
| Bento William F | $375,000 | -- | |
| Bento William F | $375,000 | -- |
Source: Public Records
Mortgage History
| Date | Status | Borrower | Loan Amount |
|---|---|---|---|
| Previous Owner | Bento William F | $235,653 |
Source: Public Records
Tax History Compared to Growth
Tax History
| Year | Tax Paid | Tax Assessment Tax Assessment Total Assessment is a certain percentage of the fair market value that is determined by local assessors to be the total taxable value of land and additions on the property. | Land | Improvement |
|---|---|---|---|---|
| 2025 | $4,604 | $350,100 | $0 | $350,100 |
| 2024 | $4,320 | $350,100 | $0 | $350,100 |
| 2023 | $4,628 | $273,200 | $0 | $273,200 |
| 2022 | $4,530 | $273,200 | $0 | $273,200 |
| 2021 | $4,530 | $273,200 | $0 | $273,200 |
| 2020 | $4,249 | $203,400 | $0 | $203,400 |
| 2019 | $4,249 | $203,400 | $0 | $203,400 |
| 2018 | $4,094 | $203,400 | $0 | $203,400 |
| 2017 | $5,691 | $250,500 | $0 | $250,500 |
| 2016 | $5,483 | $250,500 | $0 | $250,500 |
| 2015 | $5,483 | $250,500 | $0 | $250,500 |
| 2014 | $6,275 | $272,100 | $0 | $272,100 |
Source: Public Records
About Riverfront Lofts
Map
Nearby Homes
- 10 Exchange Ct Unit 203
- 10 Exchange Ct Unit 506
- 36 Underwood St
- 166 Division St
- 396 Roosevelt Ave
- 28 Bayley St Unit 107
- 78 Barton St
- 19 Wood St
- 168 Central Ave
- 186 Summit St
- 176 Central Ave
- 75 Olive St
- 300 Front St Unit 105
- 41 Arch St
- 45 Harrison St
- 70 Brewster St
- 146 S Bend St
- 44 Pawtucket Ave
- 511 High St
- 47 Grace St
- 10 Exchange Ct Unit 410
- 10 Exchange Ct Unit 606
- 10 Exchange Ct Unit 308
- 10 Exchange Ct Unit 101
- 10 Exchange Ct Unit 403
- 10 Exchange Ct Unit 309
- 10 Exchange Ct Unit 202
- 10 Exchange Ct Unit 617
- 10 Exchange Ct Unit 615
- 10 Exchange Ct Unit 401
- 10 Exchange Ct Unit 611
- 10 Exchange Ct Unit 502
- 10 Exchange Ct Unit 405
- 10 Exchange Ct Unit 310
- 10 Exchange Ct Unit 307
- 10 Exchange Ct Unit 503
- 10 Exchange Ct Unit 409
- 10 Exchange Ct Unit 305
- 10 Exchange Ct Unit 206
- 10 Exchange Ct Unit 508