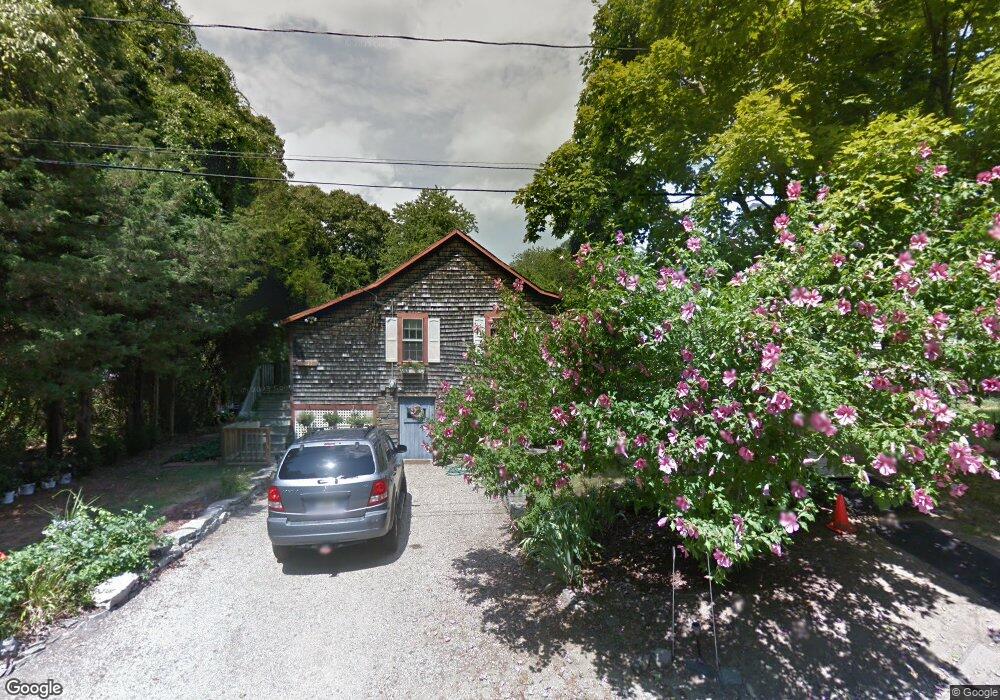
10 Ferry St Jamestown, RI 02835
Jamestown Shores NeighborhoodEstimated Value: $524,344 - $687,000
2
Beds
1
Bath
651
Sq Ft
$933/Sq Ft
Est. Value
About This Home
This home is located at 10 Ferry St, Jamestown, RI 02835 and is currently estimated at $607,586, approximately $933 per square foot. 10 Ferry St is a home located in Newport County with nearby schools including Melrose Avenue School and Lawn Avenue School.
Ownership History
Date
Name
Owned For
Owner Type
Purchase Details
Closed on
May 1, 2018
Sold by
Taylor John C and Taylor Elizabeth M
Bought by
Taylor Ft
Current Estimated Value
Purchase Details
Closed on
May 1, 1998
Sold by
Mikolay Michael A and Mikolay Jay
Bought by
Taylor John C and Taylor Elizabeth
Home Financials for this Owner
Home Financials are based on the most recent Mortgage that was taken out on this home.
Original Mortgage
$60,000
Interest Rate
7.04%
Purchase Details
Closed on
Jul 19, 1994
Sold by
Kopp Blaine S and Libby Maria L
Bought by
Mikolay Joy A and Mikolay Michael
Home Financials for this Owner
Home Financials are based on the most recent Mortgage that was taken out on this home.
Original Mortgage
$97,000
Interest Rate
8.51%
Purchase Details
Closed on
Jun 8, 1992
Sold by
Ruediger Bernt
Bought by
Kopp Blaine
Create a Home Valuation Report for This Property
The Home Valuation Report is an in-depth analysis detailing your home's value as well as a comparison with similar homes in the area
Home Values in the Area
Average Home Value in this Area
Purchase History
| Date | Buyer | Sale Price | Title Company |
|---|---|---|---|
| Taylor Ft | -- | -- | |
| Taylor John C | $124,000 | -- | |
| Mikolay Joy A | $121,500 | -- | |
| Kopp Blaine | $112,000 | -- |
Source: Public Records
Mortgage History
| Date | Status | Borrower | Loan Amount |
|---|---|---|---|
| Previous Owner | Kopp Blaine | $100,000 | |
| Previous Owner | Kopp Blaine | $60,100 | |
| Previous Owner | Kopp Blaine | $60,000 | |
| Previous Owner | Kopp Blaine | $97,000 |
Source: Public Records
Tax History
| Year | Tax Paid | Tax Assessment Tax Assessment Total Assessment is a certain percentage of the fair market value that is determined by local assessors to be the total taxable value of land and additions on the property. | Land | Improvement |
|---|---|---|---|---|
| 2025 | $2,173 | $385,200 | $226,600 | $158,600 |
| 2024 | $1,986 | $277,000 | $171,700 | $105,300 |
| 2023 | $1,933 | $277,000 | $171,700 | $105,300 |
| 2022 | $1,881 | $277,000 | $171,700 | $105,300 |
| 2021 | $1,847 | $223,100 | $134,500 | $88,600 |
| 2020 | $1,800 | $223,100 | $134,500 | $88,600 |
| 2019 | $1,796 | $223,100 | $134,500 | $88,600 |
| 2018 | $1,782 | $201,400 | $120,700 | $80,700 |
| 2017 | $1,744 | $201,400 | $120,700 | $80,700 |
| 2016 | $1,728 | $201,400 | $120,700 | $80,700 |
| 2015 | $1,672 | $190,400 | $141,100 | $49,300 |
| 2014 | $1,666 | $190,400 | $141,100 | $49,300 |
Source: Public Records
Map
Nearby Homes
- 174 Seaside Dr
- 121 Seaside Dr
- 86 Spanker St
- 44 Mast St
- 400 Schooner Ave
- 10 Coulter St
- 777 E Shore Rd
- 31 Buloid Ave
- 127 Longfellow Rd
- 63 Longfellow Rd
- 30 W Bay View Dr
- 46 North Rd
- 73 Conanicus Ave Unit 4
- 78 Narragansett Ave
- 77 Narragansett Ave Unit C
- 14 Clinton Ave
- 22 Cole St
- 0 Circuit Ave
- 0 Walcott Ave
- 30 Walcott Ave
Your Personal Tour Guide
Ask me questions while you tour the home.