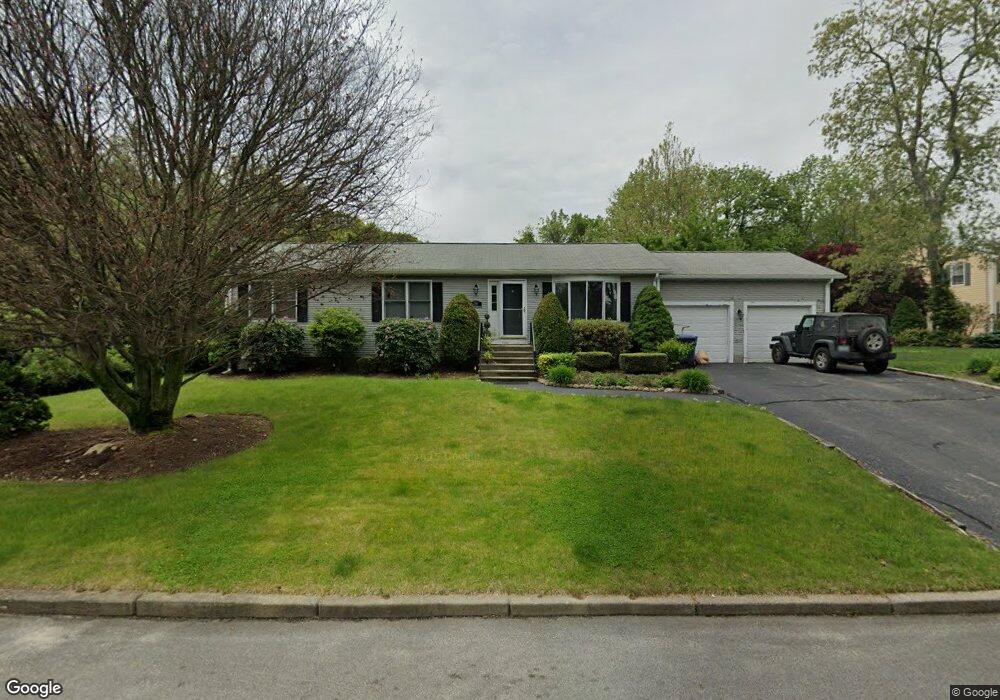
10 Fox Run Cranston, RI 02921
Western Cranston NeighborhoodEstimated Value: $539,095 - $613,000
3
Beds
2
Baths
1,300
Sq Ft
$447/Sq Ft
Est. Value
About This Home
This home is located at 10 Fox Run, Cranston, RI 02921 and is currently estimated at $581,524, approximately $447 per square foot. 10 Fox Run is a home located in Providence County with nearby schools including Oak Lawn School, Western Hills Middle School, and Cranston High School West.
Ownership History
Date
Name
Owned For
Owner Type
Purchase Details
Closed on
Nov 17, 2021
Sold by
Corey Ryan C and Corey Marissa A
Bought by
Corey Ryan C
Current Estimated Value
Home Financials for this Owner
Home Financials are based on the most recent Mortgage that was taken out on this home.
Original Mortgage
$295,000
Outstanding Balance
$226,112
Interest Rate
2.33%
Mortgage Type
New Conventional
Estimated Equity
$355,412
Purchase Details
Closed on
Jul 13, 2006
Sold by
Ethier Irene
Bought by
Corey Marissa and Corey Ryan
Home Financials for this Owner
Home Financials are based on the most recent Mortgage that was taken out on this home.
Original Mortgage
$226,000
Interest Rate
6.71%
Mortgage Type
Purchase Money Mortgage
Create a Home Valuation Report for This Property
The Home Valuation Report is an in-depth analysis detailing your home's value as well as a comparison with similar homes in the area
Home Values in the Area
Average Home Value in this Area
Purchase History
| Date | Buyer | Sale Price | Title Company |
|---|---|---|---|
| Corey Ryan C | -- | None Available | |
| Corey Marissa | $335,000 | -- |
Source: Public Records
Mortgage History
| Date | Status | Borrower | Loan Amount |
|---|---|---|---|
| Open | Corey Ryan C | $295,000 | |
| Previous Owner | Corey Marissa | $50,000 | |
| Previous Owner | Corey Marissa | $234,900 | |
| Previous Owner | Corey Marissa | $245,000 | |
| Previous Owner | Corey Marissa | $226,000 |
Source: Public Records
Tax History Compared to Growth
Tax History
| Year | Tax Paid | Tax Assessment Tax Assessment Total Assessment is a certain percentage of the fair market value that is determined by local assessors to be the total taxable value of land and additions on the property. | Land | Improvement |
|---|---|---|---|---|
| 2025 | $6,197 | $446,500 | $167,700 | $278,800 |
| 2024 | $6,077 | $446,500 | $167,700 | $278,800 |
| 2023 | $5,999 | $317,400 | $119,900 | $197,500 |
| 2022 | $5,875 | $317,400 | $119,900 | $197,500 |
| 2021 | $5,713 | $317,400 | $119,900 | $197,500 |
| 2020 | $5,697 | $274,300 | $124,200 | $150,100 |
| 2019 | $5,697 | $274,300 | $124,200 | $150,100 |
| 2018 | $5,566 | $274,300 | $124,200 | $150,100 |
| 2017 | $5,476 | $238,700 | $111,300 | $127,400 |
| 2016 | $5,359 | $238,700 | $111,300 | $127,400 |
| 2015 | $5,359 | $238,700 | $111,300 | $127,400 |
| 2014 | $5,367 | $235,000 | $107,000 | $128,000 |
Source: Public Records
Map
Nearby Homes
- 102 Moccasin Trail
- 0 Anthony Dr Unit 1394338
- 18 Quail Ridge Rd
- 80 Tomahawk Trail
- 311 Hope Rd
- 10 Honey Lou Ct
- 40 Phenix Ridge Dr
- 1213 Phenix Ave
- 2 Mulberry Dr
- 2 Honeysuckle Dr
- 105 Amy Dr
- 95 Amy Dr
- 59 Camden Ln
- 121 Ashbrook Dr
- 178 Highland St
- 180 Highland St
- 20 Doreen Ct
- 64 Cardinal Rd
- 26 Scituate Farms Dr
- 0 Wain St