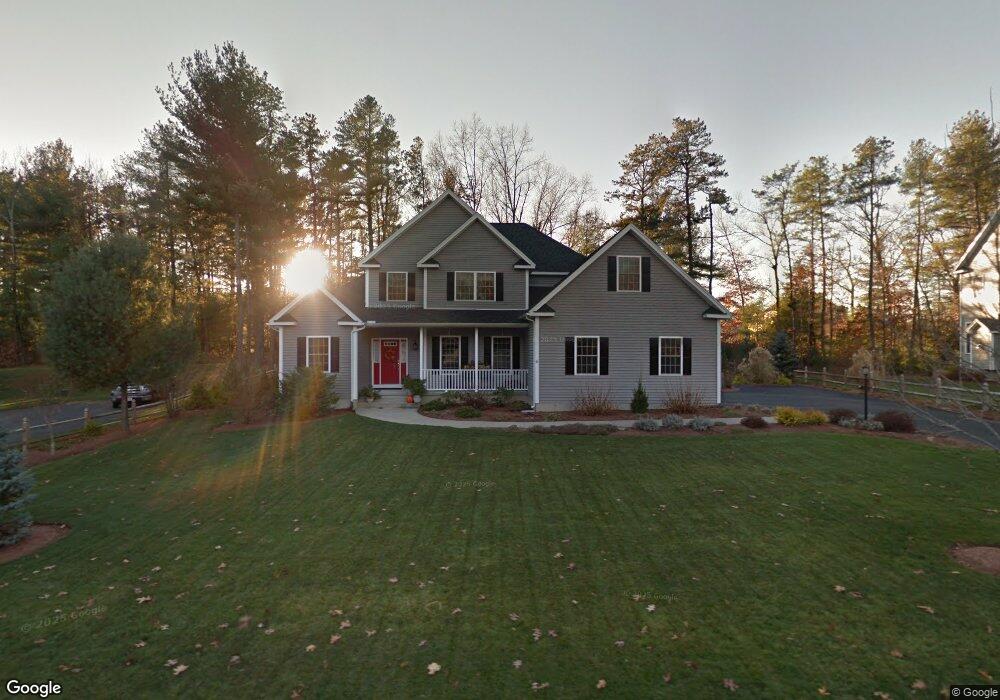
10 Fox Run Easthampton, MA 01027
Estimated Value: $764,000 - $929,000
3
Beds
3
Baths
1,800
Sq Ft
$468/Sq Ft
Est. Value
About This Home
This home is located at 10 Fox Run, Easthampton, MA 01027 and is currently estimated at $842,887, approximately $468 per square foot. 10 Fox Run is a home located in Hampshire County with nearby schools including Easthampton High School, Calvary Baptist Christian School, and Tri-County Schools.
Ownership History
Date
Name
Owned For
Owner Type
Purchase Details
Closed on
Nov 5, 2009
Sold by
David A Hardy Contr Ll
Bought by
Day Kevin R and Day Laurel M
Current Estimated Value
Home Financials for this Owner
Home Financials are based on the most recent Mortgage that was taken out on this home.
Original Mortgage
$150,000
Outstanding Balance
$98,244
Interest Rate
5.06%
Mortgage Type
Purchase Money Mortgage
Estimated Equity
$744,643
Create a Home Valuation Report for This Property
The Home Valuation Report is an in-depth analysis detailing your home's value as well as a comparison with similar homes in the area
Home Values in the Area
Average Home Value in this Area
Purchase History
| Date | Buyer | Sale Price | Title Company |
|---|---|---|---|
| Day Kevin R | $431,000 | -- |
Source: Public Records
Mortgage History
| Date | Status | Borrower | Loan Amount |
|---|---|---|---|
| Open | Day Kevin R | $150,000 |
Source: Public Records
Tax History
| Year | Tax Paid | Tax Assessment Tax Assessment Total Assessment is a certain percentage of the fair market value that is determined by local assessors to be the total taxable value of land and additions on the property. | Land | Improvement |
|---|---|---|---|---|
| 2025 | $10,019 | $732,900 | $132,200 | $600,700 |
| 2024 | $8,339 | $615,000 | $128,500 | $486,500 |
| 2023 | $6,266 | $427,700 | $101,400 | $326,300 |
| 2022 | $7,070 | $427,700 | $101,400 | $326,300 |
| 2021 | $7,814 | $445,500 | $101,400 | $344,100 |
| 2020 | $7,596 | $427,700 | $101,400 | $326,300 |
| 2019 | $6,764 | $437,500 | $118,300 | $319,200 |
| 2018 | $6,498 | $406,100 | $111,700 | $294,400 |
| 2017 | $6,340 | $391,100 | $107,400 | $283,700 |
| 2016 | $6,189 | $397,000 | $107,400 | $289,600 |
| 2015 | $6,015 | $397,000 | $107,400 | $289,600 |
Source: Public Records
Map
Nearby Homes
Your Personal Tour Guide
Ask me questions while you tour the home.