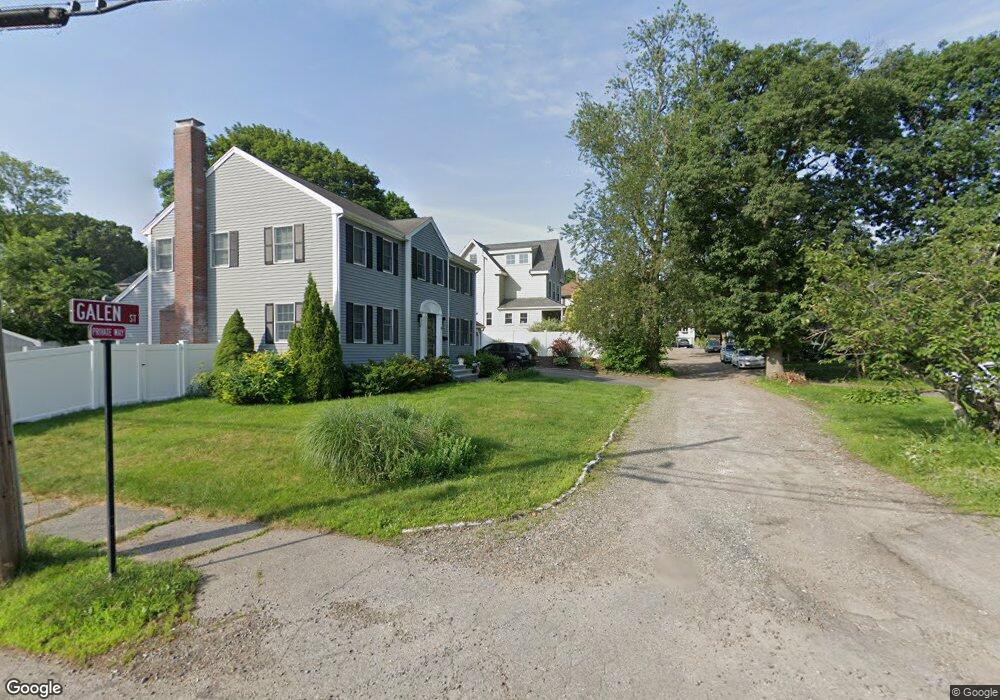
10 Galen St Milton, MA 02186
Estimated Value: $900,472 - $1,089,000
4
Beds
1
Bath
1,805
Sq Ft
$558/Sq Ft
Est. Value
About This Home
This home is located at 10 Galen St, Milton, MA 02186 and is currently estimated at $1,006,368, approximately $557 per square foot. 10 Galen St is a home located in Norfolk County with nearby schools including Milton High School, St. Agatha School, and Milton Academy.
Ownership History
Date
Name
Owned For
Owner Type
Purchase Details
Closed on
Dec 28, 2017
Sold by
Eyster Louis and Eyster Sara
Bought by
Romano Bryan and Regan Sheila
Current Estimated Value
Home Financials for this Owner
Home Financials are based on the most recent Mortgage that was taken out on this home.
Original Mortgage
$530,625
Outstanding Balance
$447,899
Interest Rate
3.95%
Mortgage Type
New Conventional
Estimated Equity
$558,469
Purchase Details
Closed on
May 31, 2012
Sold by
Greaney Maureen H and Evans Frank
Bought by
Eyster Louis and Eyster Sara
Purchase Details
Closed on
Nov 28, 1988
Sold by
Mcgrail John W
Bought by
Greaney Maureen H
Home Financials for this Owner
Home Financials are based on the most recent Mortgage that was taken out on this home.
Original Mortgage
$146,400
Interest Rate
10.21%
Mortgage Type
Purchase Money Mortgage
Create a Home Valuation Report for This Property
The Home Valuation Report is an in-depth analysis detailing your home's value as well as a comparison with similar homes in the area
Home Values in the Area
Average Home Value in this Area
Purchase History
| Date | Buyer | Sale Price | Title Company |
|---|---|---|---|
| Romano Bryan | $707,500 | -- | |
| Eyster Louis | $330,000 | -- | |
| Greaney Maureen H | $183,000 | -- |
Source: Public Records
Mortgage History
| Date | Status | Borrower | Loan Amount |
|---|---|---|---|
| Open | Romano Bryan | $530,625 | |
| Previous Owner | Greaney Maureen H | $146,400 |
Source: Public Records
Tax History Compared to Growth
Tax History
| Year | Tax Paid | Tax Assessment Tax Assessment Total Assessment is a certain percentage of the fair market value that is determined by local assessors to be the total taxable value of land and additions on the property. | Land | Improvement |
|---|---|---|---|---|
| 2025 | $8,505 | $766,900 | $457,700 | $309,200 |
| 2024 | $8,361 | $765,700 | $435,900 | $329,800 |
| 2023 | $8,421 | $738,700 | $415,200 | $323,500 |
| 2022 | $8,315 | $666,800 | $415,200 | $251,600 |
| 2021 | $7,487 | $570,200 | $330,600 | $239,600 |
| 2020 | $7,209 | $549,500 | $316,800 | $232,700 |
| 2019 | $7,030 | $533,400 | $307,500 | $225,900 |
| 2018 | $6,739 | $488,000 | $264,500 | $223,500 |
| 2017 | $6,305 | $465,000 | $251,900 | $213,100 |
| 2016 | $5,883 | $435,800 | $227,900 | $207,900 |
| 2015 | $5,509 | $395,200 | $209,900 | $185,300 |
Source: Public Records
Map
Nearby Homes
- 111-113 Pleasant St
- 40 Lyman Rd
- 29 Maitland St
- 403405 Reedsdale Rd
- 675 Randolph Ave
- 407 Highland St
- 418 Pleasant St
- 50 Marine Rd
- 795 Brook Rd
- 461 Centre St
- 46 Century Ln
- 19 Lantern Ln
- 6 Brewster Rd
- 651 Canton Ave
- 639 Pleasant St Unit 639
- 639 Pleasant St
- 54 Elm St
- 390 Central Ave
- 438 Central Ave Unit 2
- 73 Sassamon Ave