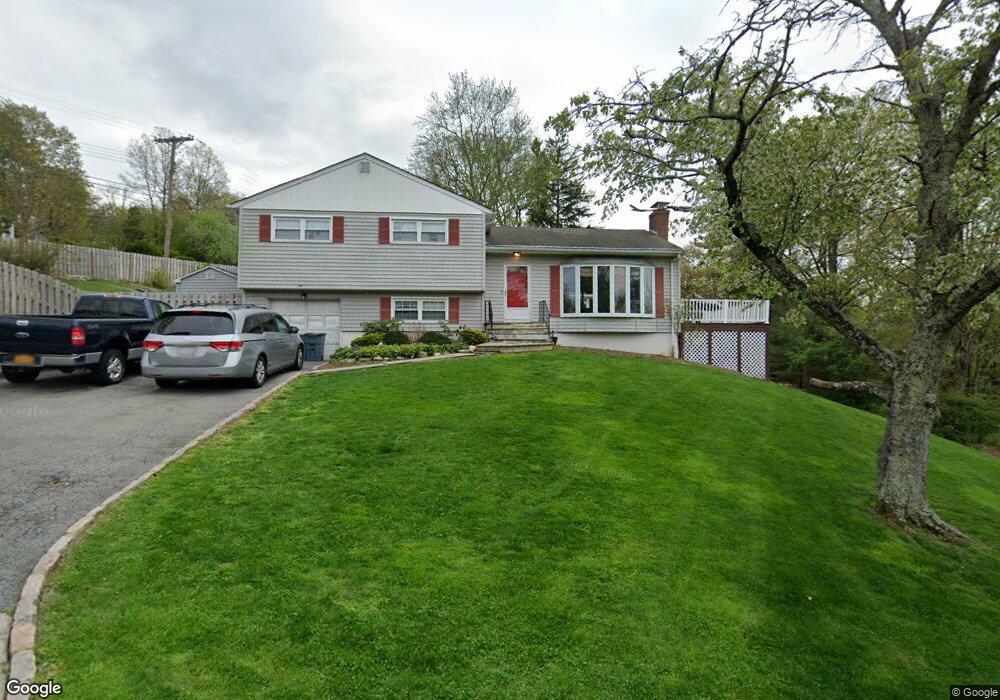
10 Ganung Dr Ossining, NY 10562
North Ossining NeighborhoodEstimated Value: $680,000 - $775,000
3
Beds
3
Baths
1,706
Sq Ft
$429/Sq Ft
Est. Value
About This Home
This home is located at 10 Ganung Dr, Ossining, NY 10562 and is currently estimated at $732,116, approximately $429 per square foot. 10 Ganung Dr is a home located in Westchester County with nearby schools including Park School, Roosevelt Elementary School, and Brookside Elementary School.
Ownership History
Date
Name
Owned For
Owner Type
Purchase Details
Closed on
Oct 19, 2009
Sold by
Harbort George R
Bought by
Lotierzo Charles E and Lotierzo Rebecca A
Current Estimated Value
Home Financials for this Owner
Home Financials are based on the most recent Mortgage that was taken out on this home.
Original Mortgage
$368,207
Outstanding Balance
$237,719
Interest Rate
4.86%
Mortgage Type
FHA
Estimated Equity
$494,397
Create a Home Valuation Report for This Property
The Home Valuation Report is an in-depth analysis detailing your home's value as well as a comparison with similar homes in the area
Home Values in the Area
Average Home Value in this Area
Purchase History
| Date | Buyer | Sale Price | Title Company |
|---|---|---|---|
| Lotierzo Charles E | $375,000 | Thoroughbred Title Services |
Source: Public Records
Mortgage History
| Date | Status | Borrower | Loan Amount |
|---|---|---|---|
| Open | Lotierzo Charles E | $368,207 |
Source: Public Records
Tax History
| Year | Tax Paid | Tax Assessment Tax Assessment Total Assessment is a certain percentage of the fair market value that is determined by local assessors to be the total taxable value of land and additions on the property. | Land | Improvement |
|---|---|---|---|---|
| 2024 | $14,809 | $549,900 | $187,500 | $362,400 |
| 2023 | $14,048 | $514,300 | $187,500 | $326,800 |
| 2022 | $13,655 | $460,000 | $187,500 | $272,500 |
| 2021 | $13,734 | $418,200 | $187,500 | $230,700 |
| 2020 | $12,883 | $418,200 | $187,500 | $230,700 |
| 2019 | $12,684 | $385,100 | $187,500 | $197,600 |
| 2018 | $12,630 | $385,100 | $187,500 | $197,600 |
| 2017 | $7,457 | $381,400 | $187,500 | $193,900 |
| 2016 | $135,426 | $370,300 | $187,500 | $182,800 |
| 2015 | $9,121 | $20,700 | $6,500 | $14,200 |
| 2014 | $9,121 | $19,600 | $6,500 | $13,100 |
| 2013 | $9,121 | $19,600 | $6,500 | $13,100 |
Source: Public Records
Map
Nearby Homes
- 19 Donald Ln
- 33 Ryder Rd
- 42 Campwoods Grounds
- 65 Morningside Dr
- 16 Robin St
- 83 Somerstown Rd
- 62 Whitson Rd
- 1C Calam Ave
- 94 Somerstown Rd
- 19 Forest Ave
- 21 Candlewood Ct
- 110 Morningside Dr
- 5 Robert Rinaldi Ln
- 7 Grandview Ave
- 48 Pershing Ave
- 48 Cypress Ln
- 41 Croton Dam Rd
- 132 Croton Ave
- 40 Minkel Rd
- 7 Hawkes Ave
Your Personal Tour Guide
Ask me questions while you tour the home.