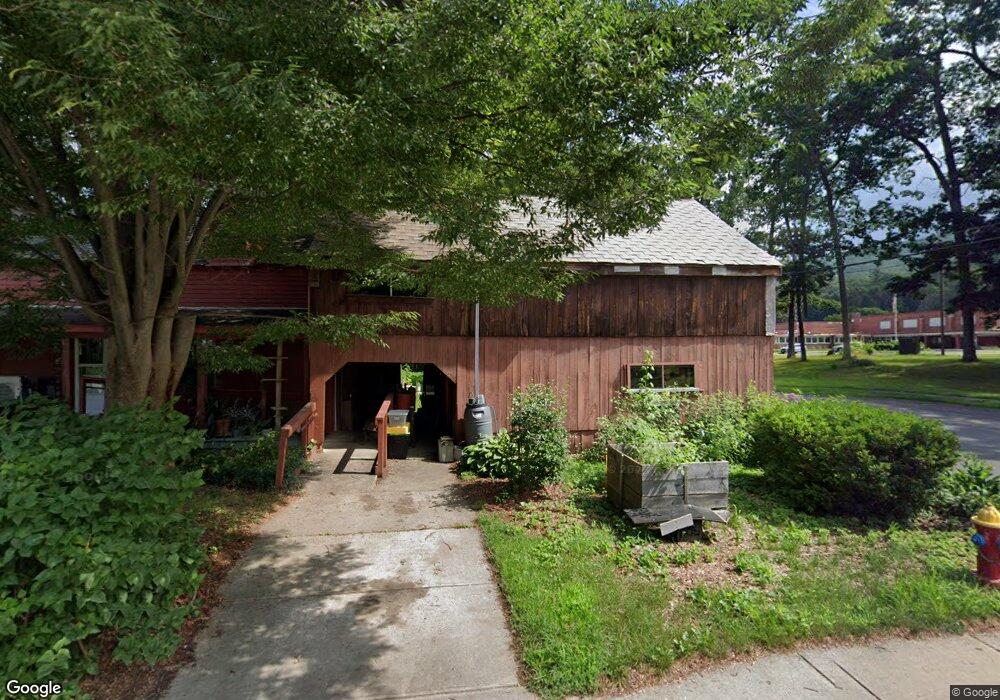
10 Grove St Shelburne Falls, MA 01370
Estimated Value: $430,000 - $520,000
6
Beds
2
Baths
2,300
Sq Ft
$202/Sq Ft
Est. Value
About This Home
This home is located at 10 Grove St, Shelburne Falls, MA 01370 and is currently estimated at $465,147, approximately $202 per square foot. 10 Grove St is a home located in Franklin County with nearby schools including Mohawk Trail Regional High School.
Ownership History
Date
Name
Owned For
Owner Type
Purchase Details
Closed on
Dec 28, 2018
Sold by
Bishop Richard C
Bought by
Miller Robert and Miller Nicolas R
Current Estimated Value
Purchase Details
Closed on
Aug 14, 2015
Sold by
Miller Robert
Bought by
Miller Zachary A and Miller Nicolas R
Purchase Details
Closed on
Aug 15, 1989
Sold by
Streeter Family
Bought by
Miller Robert
Create a Home Valuation Report for This Property
The Home Valuation Report is an in-depth analysis detailing your home's value as well as a comparison with similar homes in the area
Home Values in the Area
Average Home Value in this Area
Purchase History
| Date | Buyer | Sale Price | Title Company |
|---|---|---|---|
| Miller Robert | -- | -- | |
| Miller Zachary A | -- | -- | |
| Miller Robert | $11,000 | -- |
Source: Public Records
Mortgage History
| Date | Status | Borrower | Loan Amount |
|---|---|---|---|
| Previous Owner | Miller Robert | $100,000 |
Source: Public Records
Tax History Compared to Growth
Tax History
| Year | Tax Paid | Tax Assessment Tax Assessment Total Assessment is a certain percentage of the fair market value that is determined by local assessors to be the total taxable value of land and additions on the property. | Land | Improvement |
|---|---|---|---|---|
| 2025 | $4,779 | $372,200 | $78,600 | $293,600 |
| 2024 | $4,877 | $367,800 | $78,600 | $289,200 |
| 2023 | $4,877 | $357,300 | $78,600 | $278,700 |
| 2022 | $5,161 | $356,200 | $78,600 | $277,600 |
| 2021 | $4,820 | $333,100 | $71,500 | $261,600 |
| 2020 | $4,616 | $330,200 | $75,000 | $255,200 |
| 2019 | $104 | $308,700 | $71,400 | $237,300 |
| 2018 | $4,413 | $280,000 | $59,900 | $220,100 |
| 2017 | $4,125 | $277,800 | $59,900 | $217,900 |
| 2015 | $4,168 | $300,100 | $60,900 | $239,200 |
| 2014 | $4,087 | $300,100 | $60,900 | $239,200 |
Source: Public Records
Map
Nearby Homes
- 105 - 107 Bridge St
- 33 Williams St
- 10 Deerfield Ave Unit 5
- 10 Deerfield Ave Unit 2
- 102 Elm St
- 2151 Route 2
- 2155 Massachusetts 2
- 7 Hog Hollow Rd
- 156 Ashfield Rd
- 31 W Oxbow Rd
- 24 W Oxbow Rd
- 0 Upper St
- 0 W Oxbow Rd Unit 73453651
- 3+5 Church St
- 0 Fiske Mill Rd
- 0 Ashfield Rd
- 143 Charlemont Rd
- 85 Dacey Rd
- lot 1 Shelburne Falls Rd
- 32 Navaho Ln