Estimated Value: $1,088,000 - $1,377,000
5
Beds
6
Baths
4,346
Sq Ft
$281/Sq Ft
Est. Value
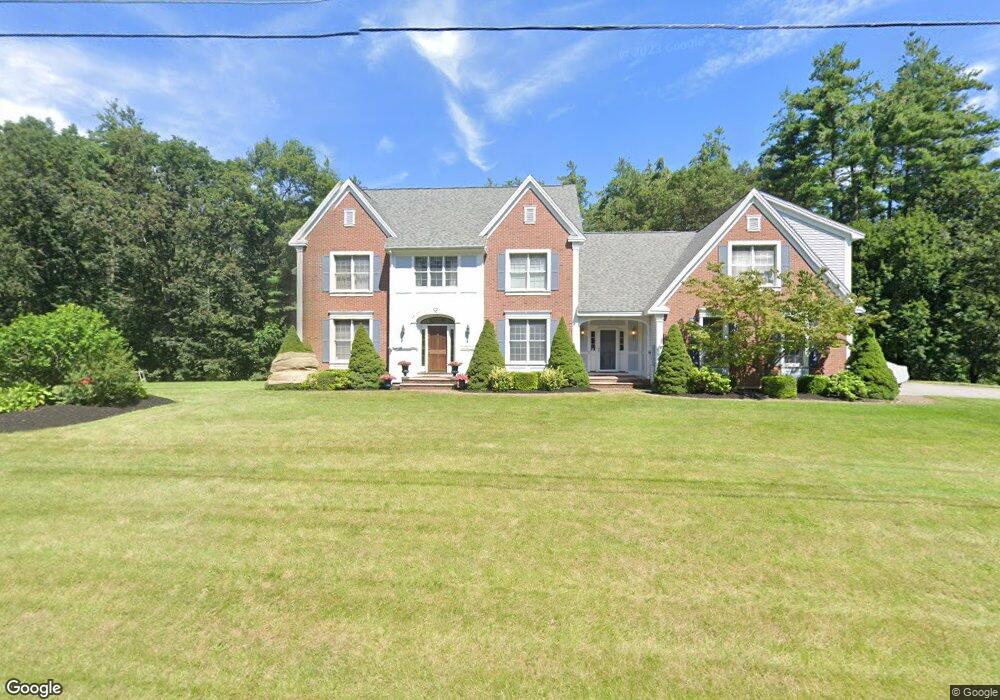
About This Home
This home is located at 10 Hall Ave, Salem, NH 03079 and is currently estimated at $1,220,630, approximately $280 per square foot. 10 Hall Ave is a home located in Rockingham County with nearby schools including Mary A. Fisk Elementary School, Woodbury School, and Salem High School.
Ownership History
Date
Name
Owned For
Owner Type
Purchase Details
Closed on
Oct 27, 1999
Sold by
Rothenberger Scott D and Rothenberger Vicki L
Bought by
Zani Mark A and Zani Kathleen F
Current Estimated Value
Home Financials for this Owner
Home Financials are based on the most recent Mortgage that was taken out on this home.
Original Mortgage
$528,000
Outstanding Balance
$147,653
Interest Rate
7.78%
Estimated Equity
$1,072,977
Purchase Details
Closed on
May 23, 1996
Sold by
Richard Michael Inc
Bought by
Rothenberger Scott D and Rothenberger Vicki L
Home Financials for this Owner
Home Financials are based on the most recent Mortgage that was taken out on this home.
Original Mortgage
$365,850
Interest Rate
8.01%
Create a Home Valuation Report for This Property
The Home Valuation Report is an in-depth analysis detailing your home's value as well as a comparison with similar homes in the area
Purchase History
| Date | Buyer | Sale Price | Title Company |
|---|---|---|---|
| Zani Mark A | $660,000 | -- | |
| Rothenberger Scott D | $95,000 | -- | |
| Richard Michael Inc | $65,000 | -- |
Source: Public Records
Mortgage History
| Date | Status | Borrower | Loan Amount |
|---|---|---|---|
| Open | Richard Michael Inc | $528,000 | |
| Previous Owner | Richard Michael Inc | $365,850 |
Source: Public Records
Tax History
| Year | Tax Paid | Tax Assessment Tax Assessment Total Assessment is a certain percentage of the fair market value that is determined by local assessors to be the total taxable value of land and additions on the property. | Land | Improvement |
|---|---|---|---|---|
| 2024 | $16,129 | $916,400 | $256,800 | $659,600 |
| 2023 | $15,542 | $916,400 | $256,800 | $659,600 |
| 2022 | $14,708 | $916,400 | $256,800 | $659,600 |
| 2021 | $14,644 | $916,400 | $256,800 | $659,600 |
| 2020 | $16,284 | $739,500 | $183,300 | $556,200 |
| 2019 | $16,254 | $739,500 | $183,300 | $556,200 |
| 2018 | $15,706 | $726,800 | $183,300 | $543,500 |
| 2017 | $15,147 | $726,800 | $183,300 | $543,500 |
| 2016 | $14,849 | $726,800 | $183,300 | $543,500 |
| 2015 | $14,342 | $670,500 | $174,400 | $496,100 |
| 2014 | $13,940 | $670,500 | $174,400 | $496,100 |
| 2013 | $13,718 | $670,500 | $174,400 | $496,100 |
Source: Public Records
Map
Nearby Homes
Your Personal Tour Guide
Ask me questions while you tour the home.