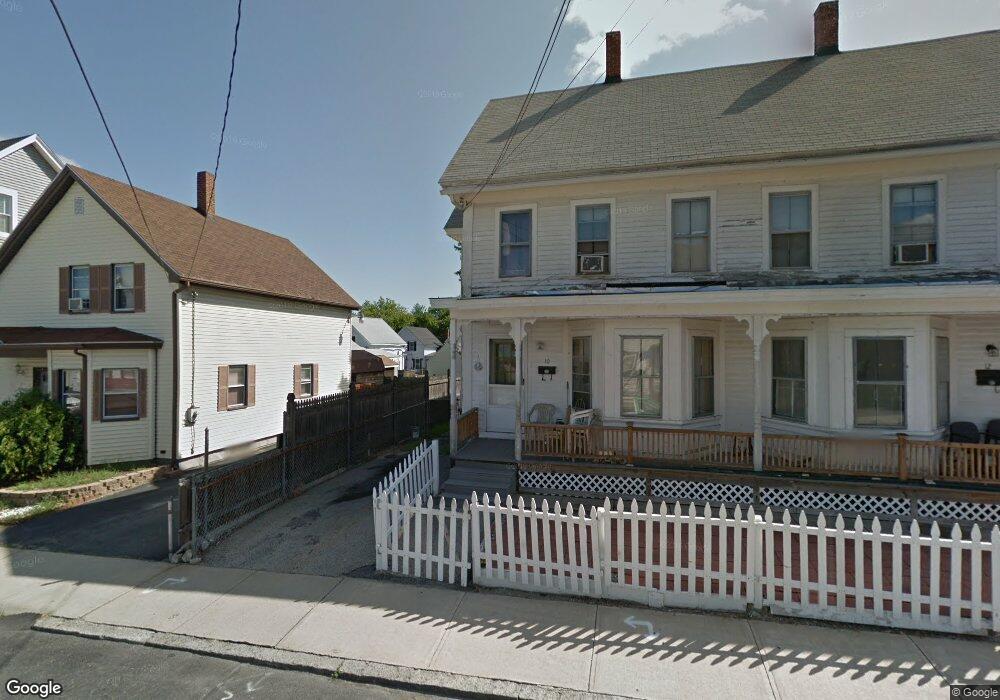
10 Hanover St Nashua, NH 03060
South End Nashua NeighborhoodEstimated Value: $517,873 - $643,000
4
Beds
2
Baths
1,385
Sq Ft
$421/Sq Ft
Est. Value
About This Home
This home is located at 10 Hanover St, Nashua, NH 03060 and is currently estimated at $583,718, approximately $421 per square foot. 10 Hanover St is a home located in Hillsborough County with nearby schools including Ledge Street Elementary School, Fairgrounds Middle School, and Nashua High School South.
Ownership History
Date
Name
Owned For
Owner Type
Purchase Details
Closed on
Jun 18, 2019
Sold by
A & R Investments Llc
Bought by
Sovic Marianna
Current Estimated Value
Home Financials for this Owner
Home Financials are based on the most recent Mortgage that was taken out on this home.
Original Mortgage
$309,294
Outstanding Balance
$271,380
Interest Rate
4.1%
Mortgage Type
FHA
Estimated Equity
$312,338
Purchase Details
Closed on
Nov 20, 2018
Sold by
Shrestha Arbind
Bought by
A & R Investments Llc
Home Financials for this Owner
Home Financials are based on the most recent Mortgage that was taken out on this home.
Original Mortgage
$215,000
Interest Rate
4.7%
Mortgage Type
New Conventional
Purchase Details
Closed on
Feb 16, 2016
Sold by
Sunrise Homes Llc
Bought by
Shrestha Arbind
Home Financials for this Owner
Home Financials are based on the most recent Mortgage that was taken out on this home.
Original Mortgage
$175,000
Interest Rate
4.02%
Mortgage Type
Commercial
Purchase Details
Closed on
Feb 9, 2016
Sold by
Ortiz Elliott F and Ortiz Leah M
Bought by
Sunrise Homes Llc
Home Financials for this Owner
Home Financials are based on the most recent Mortgage that was taken out on this home.
Original Mortgage
$175,000
Interest Rate
4.02%
Mortgage Type
Commercial
Purchase Details
Closed on
Jul 31, 2002
Sold by
Spooner Carolyn S
Bought by
Laplante Louise C
Create a Home Valuation Report for This Property
The Home Valuation Report is an in-depth analysis detailing your home's value as well as a comparison with similar homes in the area
Home Values in the Area
Average Home Value in this Area
Purchase History
| Date | Buyer | Sale Price | Title Company |
|---|---|---|---|
| Sovic Marianna | $315,000 | -- | |
| A & R Investments Llc | -- | -- | |
| Shrestha Arbind | $225,000 | -- | |
| Sunrise Homes Llc | $125,000 | -- | |
| Laplante Louise C | $46,000 | -- |
Source: Public Records
Mortgage History
| Date | Status | Borrower | Loan Amount |
|---|---|---|---|
| Open | Sovic Marianna | $309,294 | |
| Previous Owner | A & R Investments Llc | $215,000 | |
| Previous Owner | Shrestha Arbind | $175,000 |
Source: Public Records
Tax History Compared to Growth
Tax History
| Year | Tax Paid | Tax Assessment Tax Assessment Total Assessment is a certain percentage of the fair market value that is determined by local assessors to be the total taxable value of land and additions on the property. | Land | Improvement |
|---|---|---|---|---|
| 2024 | $8,017 | $504,200 | $119,200 | $385,000 |
| 2023 | $7,208 | $395,400 | $95,300 | $300,100 |
| 2022 | $7,145 | $395,400 | $95,300 | $300,100 |
| 2021 | $6,009 | $258,800 | $63,600 | $195,200 |
| 2020 | $4,754 | $258,800 | $63,600 | $195,200 |
| 2019 | $5,631 | $258,800 | $63,600 | $195,200 |
| 2018 | $5,489 | $258,800 | $63,600 | $195,200 |
| 2017 | $4,431 | $171,800 | $63,500 | $108,300 |
| 2016 | $4,307 | $171,800 | $63,500 | $108,300 |
| 2015 | $4,214 | $171,800 | $63,500 | $108,300 |
| 2014 | $4,132 | $171,800 | $63,500 | $108,300 |
Source: Public Records
Map
Nearby Homes
- 29 Wilder St
- 4 Badger St
- 71 Vine St Unit 713/4
- 22 Gilman St
- 30 Ledge St
- 8 Buck St Unit 10
- 121 Palm St
- 38 Central St
- 19.5 Balcom St
- 169A W Hollis St Unit 193
- 32-34 Grand Ave
- 16-18 Perry Ave
- 15 Lovell St Unit 20
- 15 Lovell St Unit 3
- 15 Lovell St Unit 10
- 70 Linwood St
- 30 Dexter St Unit 106
- 24 E Otterson St
- 13 Wason Ave Unit 29
- 22 New Dunstable Rd Unit 132133
- 12A Hanover St
- 12A Hanover St
- 12 Hanover St Unit B
- 12A Hanover St
- 8 Hanover St
- 24 Hanover St Unit 30
- 11 Wilder St
- 14 Hanover St
- 14 Hanover St Unit 1
- 14 Hanover St Unit 2
- 13 Wilder St
- 9 Wilder St
- 6 Hanover St
- 15 Hanover St
- 11-13 Hanover St
- 9 Hanover St
- 11 Hanover St Unit 13
- 15 Wilder St
- 7 Wilder St
- 16 Hanover St