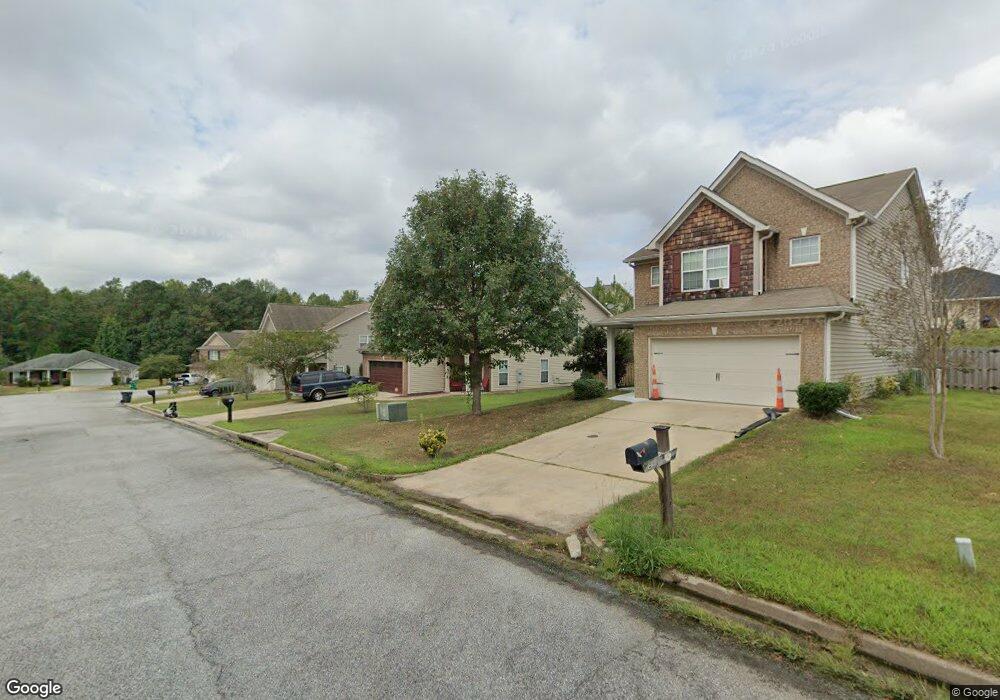
10 Harding Dr Phenix City, AL 36869
Estimated Value: $250,000 - $288,000
5
Beds
3
Baths
2,536
Sq Ft
$108/Sq Ft
Est. Value
About This Home
This home is located at 10 Harding Dr, Phenix City, AL 36869 and is currently estimated at $273,167, approximately $107 per square foot. 10 Harding Dr is a home located in Russell County with nearby schools including Ridgecrest Elementary School, South Girard School, and Phenix City Intermediate School.
Ownership History
Date
Name
Owned For
Owner Type
Purchase Details
Closed on
Oct 2, 2020
Bought by
Beleshia Thomas C
Current Estimated Value
Purchase Details
Closed on
Aug 1, 2016
Sold by
Secretary Of Housing And Urban Dev
Bought by
Johnson
Purchase Details
Closed on
Apr 14, 2016
Sold by
Jp Morgan Chase Bank Na
Bought by
Secretaryof Housing Of Urban Development
Purchase Details
Closed on
Nov 24, 2009
Sold by
Grayhawk Homes Inc
Bought by
Lee Narada and Lee Terral
Home Financials for this Owner
Home Financials are based on the most recent Mortgage that was taken out on this home.
Original Mortgage
$159,949
Interest Rate
5.01%
Mortgage Type
Purchase Money Mortgage
Create a Home Valuation Report for This Property
The Home Valuation Report is an in-depth analysis detailing your home's value as well as a comparison with similar homes in the area
Home Values in the Area
Average Home Value in this Area
Purchase History
| Date | Buyer | Sale Price | Title Company |
|---|---|---|---|
| Beleshia Thomas C | $183,500 | -- | |
| Johnson | -- | -- | |
| Secretaryof Housing Of Urban Development | -- | -- | |
| Lee Narada | $162,901 | -- |
Source: Public Records
Mortgage History
| Date | Status | Borrower | Loan Amount |
|---|---|---|---|
| Previous Owner | Lee Narada | $159,949 |
Source: Public Records
Tax History Compared to Growth
Tax History
| Year | Tax Paid | Tax Assessment Tax Assessment Total Assessment is a certain percentage of the fair market value that is determined by local assessors to be the total taxable value of land and additions on the property. | Land | Improvement |
|---|---|---|---|---|
| 2024 | $1,467 | $26,120 | $2,500 | $23,620 |
| 2023 | $1,251 | $22,454 | $2,500 | $19,954 |
| 2022 | $1,113 | $20,122 | $2,400 | $17,722 |
| 2021 | $871 | $18,206 | $2,000 | $16,206 |
| 2020 | $871 | $17,040 | $2,000 | $15,040 |
| 2019 | $0 | $16,260 | $2,000 | $14,260 |
| 2018 | $871 | $16,020 | $2,000 | $14,020 |
| 2017 | $1,912 | $15,740 | $2,000 | $13,740 |
| 2016 | $1,912 | $32,400 | $4,000 | $28,400 |
| 2015 | $837 | $30,872 | $4,000 | $26,872 |
| 2014 | $829 | $30,604 | $4,000 | $26,604 |
Source: Public Records
Map
Nearby Homes