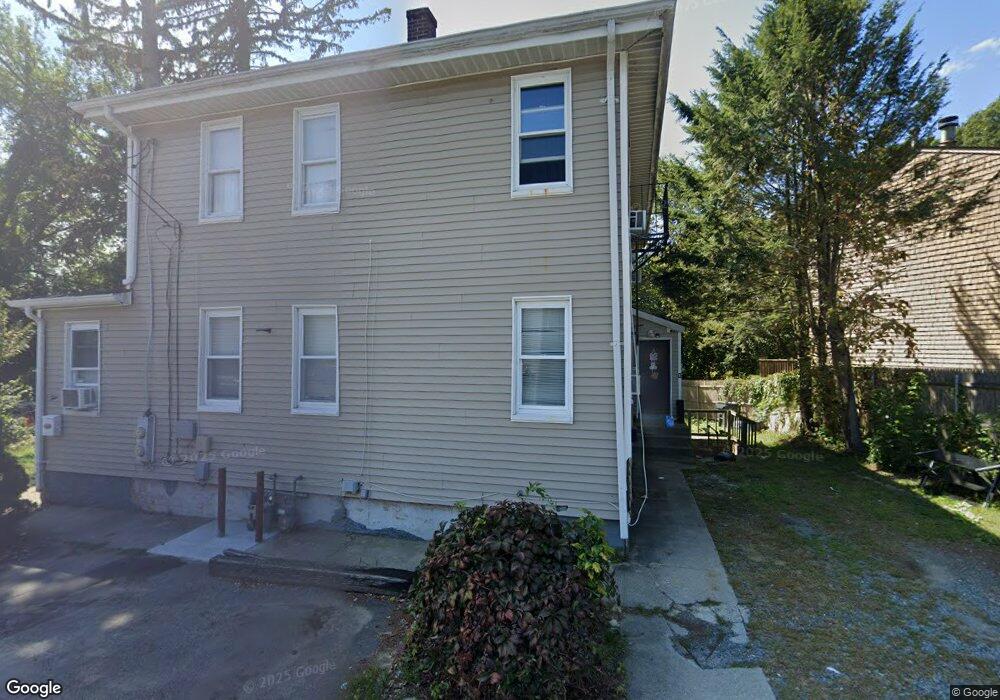
10 Harris Driftway St Cranston, RI 02920
Garden City NeighborhoodEstimated Value: $432,532 - $554,000
4
Beds
2
Baths
1,890
Sq Ft
$260/Sq Ft
Est. Value
About This Home
This home is located at 10 Harris Driftway St, Cranston, RI 02920 and is currently estimated at $490,633, approximately $259 per square foot. 10 Harris Driftway St is a home located in Providence County with nearby schools including Garden City School, Western Hills Middle School, and Cranston High School West.
Ownership History
Date
Name
Owned For
Owner Type
Purchase Details
Closed on
Jul 25, 2018
Sold by
Ramirez Alfredo
Bought by
Smith Assoc
Current Estimated Value
Purchase Details
Closed on
Dec 16, 2011
Sold by
Columna Miguel and Columna Luz
Bought by
Abreau Ricard
Home Financials for this Owner
Home Financials are based on the most recent Mortgage that was taken out on this home.
Original Mortgage
$50,000
Interest Rate
4.01%
Purchase Details
Closed on
Jun 29, 2006
Sold by
Marizan Nicholas
Bought by
Columna Miguel and Columna Luz
Purchase Details
Closed on
Jan 17, 2003
Sold by
Dambra Vincent
Bought by
Marizan Nicholas
Purchase Details
Closed on
Nov 2, 1998
Sold by
Vose Dean A and Vose Christina
Bought by
Dambra Vincent J
Purchase Details
Closed on
May 31, 1994
Sold by
Giorgianni Christina
Bought by
Vase Dean A and Avramides Christina V
Purchase Details
Closed on
Jul 18, 1988
Sold by
Kanor Assoc
Bought by
Felicio Manuel P
Create a Home Valuation Report for This Property
The Home Valuation Report is an in-depth analysis detailing your home's value as well as a comparison with similar homes in the area
Home Values in the Area
Average Home Value in this Area
Purchase History
| Date | Buyer | Sale Price | Title Company |
|---|---|---|---|
| Smith Assoc | $2,126 | -- | |
| Abreau Ricard | $50,000 | -- | |
| Columna Miguel | $269,000 | -- | |
| Marizan Nicholas | $169,000 | -- | |
| Dambra Vincent J | $95,000 | -- | |
| Vase Dean A | $92,500 | -- | |
| Felicio Manuel P | $119,000 | -- |
Source: Public Records
Mortgage History
| Date | Status | Borrower | Loan Amount |
|---|---|---|---|
| Previous Owner | Abreau Ricard | $50,000 | |
| Previous Owner | Felicio Manuel P | $72,500 | |
| Previous Owner | Felicio Manuel P | $28,500 |
Source: Public Records
Tax History Compared to Growth
Tax History
| Year | Tax Paid | Tax Assessment Tax Assessment Total Assessment is a certain percentage of the fair market value that is determined by local assessors to be the total taxable value of land and additions on the property. | Land | Improvement |
|---|---|---|---|---|
| 2025 | $5,061 | $364,600 | $108,700 | $255,900 |
| 2024 | $4,962 | $364,600 | $108,700 | $255,900 |
| 2023 | $4,621 | $244,500 | $71,600 | $172,900 |
| 2022 | $4,526 | $244,500 | $71,600 | $172,900 |
| 2021 | $4,401 | $244,500 | $71,600 | $172,900 |
| 2020 | $4,262 | $205,200 | $68,100 | $137,100 |
| 2019 | $4,262 | $205,200 | $68,100 | $137,100 |
| 2018 | $4,164 | $205,200 | $68,100 | $137,100 |
| 2017 | $3,528 | $153,800 | $47,700 | $106,100 |
| 2016 | $3,453 | $153,800 | $47,700 | $106,100 |
| 2015 | $3,453 | $153,800 | $47,700 | $106,100 |
| 2014 | $3,305 | $144,700 | $47,700 | $97,000 |
Source: Public Records
Map
Nearby Homes
- 34 Keller Ave
- 99 Harvard St
- 105 Fordson Ave
- 113 Fordson Ave
- 31 Celestia Ave
- 132 Fordson Ave Unit 12
- 1097 Pontiac Ave
- 26 Keith Ave
- 150 Riverside Ave
- 189 Poplar Dr
- 28 Hybrid Dr
- 81 Allen Ave
- 15 Spruce Ave
- 638 Pontiac Ave
- 35 Manson Ave
- 18 Glenwood Ave
- 10 Woburn St
- 10 Sheffield Rd
- 105 Broadmoor Rd
- 200 Hoffman Ave Unit 505
- 24 Harris Driftway St
- 26 Harris Driftway St
- 24 Harris Driftway St Unit 24
- 26 Harris Driftway St Unit 26
- 24 Harris Driftway St Unit 1
- 28 Harris Driftway St
- 28 Harris Driftway St Unit 28/3
- 28 Harris Driftway St Unit 3
- 28 Harris Driftway St Unit 28
- 921 Pontiac Ave
- 25 Harris Driftway St Unit 3
- 25 Harris Driftway St Unit 6
- 25 Harris Driftway St Unit 5
- 25 Harris Driftway St Unit 4
- 25 Harris Driftway St Unit 2
- 25 Harris Driftway St Unit 1
- 25 Harris Driftway St Unit 25
- 25 Harris Driftway St
- 383 Garden City Dr
- 391 Garden City Dr