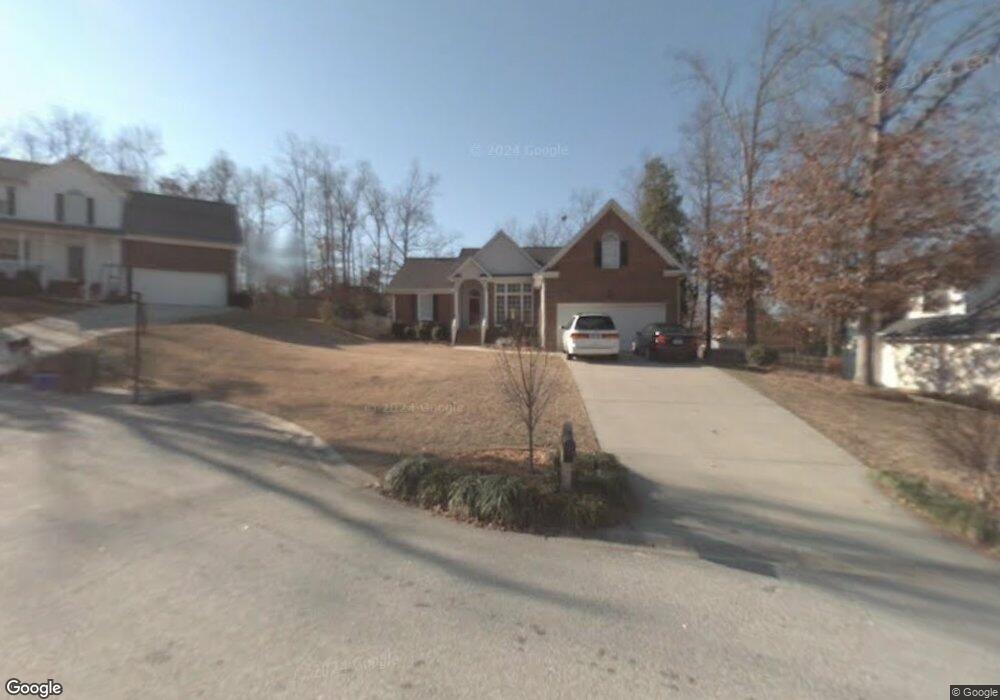
10 Harrow Ct Mauldin, SC 29662
Estimated Value: $319,000 - $330,000
3
Beds
3
Baths
2,000
Sq Ft
$163/Sq Ft
Est. Value
About This Home
This home is located at 10 Harrow Ct, Mauldin, SC 29662 and is currently estimated at $325,738, approximately $162 per square foot. 10 Harrow Ct is a home located in Greenville County with nearby schools including Greenbrier Elementary School, Hillcrest Middle School, and Mauldin High School.
Ownership History
Date
Name
Owned For
Owner Type
Purchase Details
Closed on
Dec 19, 2022
Sold by
Allerheiligen William B
Bought by
Allerheiligen Family Irrevocable House Trust
Current Estimated Value
Purchase Details
Closed on
May 8, 2013
Sold by
Allerheiligen William B and Allerheiligen Robbin C
Bought by
Allerheiligen William B and Allerheiligen Robbin C
Purchase Details
Closed on
Jun 29, 2011
Sold by
Federal Home Loan Mortgage Corporation
Bought by
Allerheiligen William B and Allerheiligen Robbin C
Home Financials for this Owner
Home Financials are based on the most recent Mortgage that was taken out on this home.
Original Mortgage
$100,100
Interest Rate
4.63%
Mortgage Type
New Conventional
Purchase Details
Closed on
Feb 17, 2011
Sold by
Vanevery Patrick and Van Every Cynthia
Bought by
Federal Home Loan Mortgage Corp
Create a Home Valuation Report for This Property
The Home Valuation Report is an in-depth analysis detailing your home's value as well as a comparison with similar homes in the area
Home Values in the Area
Average Home Value in this Area
Purchase History
| Date | Buyer | Sale Price | Title Company |
|---|---|---|---|
| Allerheiligen Family Irrevocable House Trust | -- | -- | |
| Allerheiligen William B | -- | -- | |
| Allerheiligen William B | $131,100 | -- | |
| Federal Home Loan Mortgage Corp | $138,880 | -- |
Source: Public Records
Mortgage History
| Date | Status | Borrower | Loan Amount |
|---|---|---|---|
| Previous Owner | Allerheiligen William B | $100,100 |
Source: Public Records
Tax History Compared to Growth
Tax History
| Year | Tax Paid | Tax Assessment Tax Assessment Total Assessment is a certain percentage of the fair market value that is determined by local assessors to be the total taxable value of land and additions on the property. | Land | Improvement |
|---|---|---|---|---|
| 2024 | $993 | $7,400 | $1,240 | $6,160 |
| 2023 | $993 | $7,400 | $1,240 | $6,160 |
| 2022 | $936 | $7,400 | $1,240 | $6,160 |
| 2021 | $936 | $7,400 | $1,240 | $6,160 |
| 2020 | $1,175 | $6,440 | $1,080 | $5,360 |
| 2019 | $1,175 | $6,440 | $1,080 | $5,360 |
| 2018 | $1,173 | $6,440 | $1,080 | $5,360 |
| 2017 | $1,173 | $6,440 | $1,080 | $5,360 |
| 2016 | $1,128 | $160,890 | $27,000 | $133,890 |
| 2015 | $1,128 | $160,890 | $27,000 | $133,890 |
| 2014 | $1,080 | $155,010 | $30,000 | $125,010 |
Source: Public Records
Map
Nearby Homes
- 712 Brooks Rd
- 24 Poplar Springs Dr
- 4 Natchez Dr
- 111 Golden Crest Ct
- 202 Greenport Way
- 310 Ashmore Bridge Rd
- 220 Horse Tack Trail
- 511 Wynstone Place
- 234 Paperbark Dr
- 238 Paperbark Dr
- 240 Paperbark Dr
- 242 Paperbark Dr
- 244 Paperbark Dr
- 237 Paperbark Dr
- 239 Paperbark Dr
- 415 Wynstone Place
- 243 Paperbark Dr
- 245 Paperbark Dr
- 247 Paperbark Dr