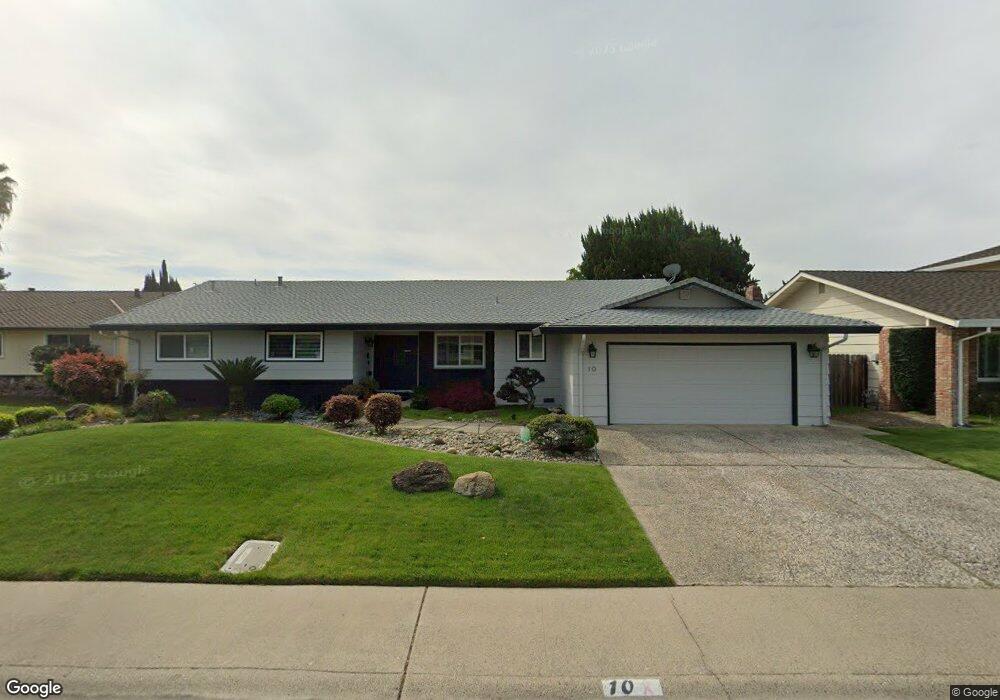
10 Havenwood Cir Sacramento, CA 95831
Pocket-Greenhaven NeighborhoodEstimated Value: $384,000 - $710,000
3
Beds
2
Baths
1,948
Sq Ft
$315/Sq Ft
Est. Value
About This Home
This home is located at 10 Havenwood Cir, Sacramento, CA 95831 and is currently estimated at $612,866, approximately $314 per square foot. 10 Havenwood Cir is a home located in Sacramento County with nearby schools including Caroline Wenzel Elementary School, Sam Brannan Middle School, and John F. Kennedy High School.
Ownership History
Date
Name
Owned For
Owner Type
Purchase Details
Closed on
Jul 12, 2021
Sold by
Imai Edward Jun
Bought by
Imai Edward and The Edward Jun Imai Living Tru
Current Estimated Value
Purchase Details
Closed on
Sep 30, 2009
Sold by
Higashidani Mitzi
Bought by
Imai Edward Jun
Home Financials for this Owner
Home Financials are based on the most recent Mortgage that was taken out on this home.
Original Mortgage
$276,000
Outstanding Balance
$179,492
Interest Rate
5.08%
Mortgage Type
New Conventional
Estimated Equity
$433,374
Purchase Details
Closed on
Sep 18, 2009
Sold by
Oda Rose I and The Yoshio Oda & Rose I Oda 19
Bought by
Imai Edward Jun
Home Financials for this Owner
Home Financials are based on the most recent Mortgage that was taken out on this home.
Original Mortgage
$276,000
Outstanding Balance
$179,492
Interest Rate
5.08%
Mortgage Type
New Conventional
Estimated Equity
$433,374
Create a Home Valuation Report for This Property
The Home Valuation Report is an in-depth analysis detailing your home's value as well as a comparison with similar homes in the area
Home Values in the Area
Average Home Value in this Area
Purchase History
| Date | Buyer | Sale Price | Title Company |
|---|---|---|---|
| Imai Edward | -- | None Available | |
| Imai Edward Jun | -- | Placer Title Company | |
| Imai Edward Jun | $345,000 | Placer Title Company |
Source: Public Records
Mortgage History
| Date | Status | Borrower | Loan Amount |
|---|---|---|---|
| Open | Imai Edward Jun | $276,000 |
Source: Public Records
Tax History Compared to Growth
Tax History
| Year | Tax Paid | Tax Assessment Tax Assessment Total Assessment is a certain percentage of the fair market value that is determined by local assessors to be the total taxable value of land and additions on the property. | Land | Improvement |
|---|---|---|---|---|
| 2025 | $5,467 | $445,321 | $103,260 | $342,061 |
| 2024 | $5,467 | $436,590 | $101,236 | $335,354 |
| 2023 | $5,333 | $428,030 | $99,251 | $328,779 |
| 2022 | $5,259 | $419,638 | $97,305 | $322,333 |
| 2021 | $5,009 | $411,411 | $95,398 | $316,013 |
| 2020 | $5,044 | $407,193 | $94,420 | $312,773 |
| 2019 | $4,938 | $399,210 | $92,569 | $306,641 |
| 2018 | $4,811 | $391,383 | $90,754 | $300,629 |
| 2017 | $4,743 | $383,710 | $88,975 | $294,735 |
| 2016 | $4,632 | $376,187 | $87,231 | $288,956 |
| 2015 | $4,561 | $370,537 | $85,921 | $284,616 |
| 2014 | $4,448 | $363,279 | $84,238 | $279,041 |
Source: Public Records
Map
Nearby Homes
- 14 Westlite Ct
- 506 Roundtree Ct
- 64 Moonlit Cir
- 763 La Contenta Way
- 792 Parklin Ave
- 37 Starlit Cir
- 1052 Johnfer Way
- 7110 Westmoreland Way
- 10 Fleet Ct
- 7170 Westmoreland Way
- 487 Twin River Way
- 6235 Allenport Way
- 989 Johnfer Way
- 966 Briarcrest Way
- 959 Johnfer Way
- 14 Morningsun Ct
- 1213 58th Ave
- 1 Sandpointe Ct
- 4 Bingham Cir
- 7036 13th St
- 6 Havenwood Cir
- 14 Havenwood Cir
- 6797 Coachlite Way
- 6801 Coachlite Way
- 9 Havenwood Cir
- 6793 Coachlite Way
- 6780 Havenside Dr
- 18 Havenwood Cir
- 5 Havenwood Cir
- 13 Havenwood Cir
- 6790 Havenside Dr
- 17 Havenwood Cir
- 6800 Havenside Dr
- 6789 Coachlite Way
- 22 Havenwood Cir
- 75 Cavalcade Cir
- 6798 Coachlite Way
- 79 Cavalcade Cir
- 71 Cavalcade Cir
- 21 Havenwood Cir