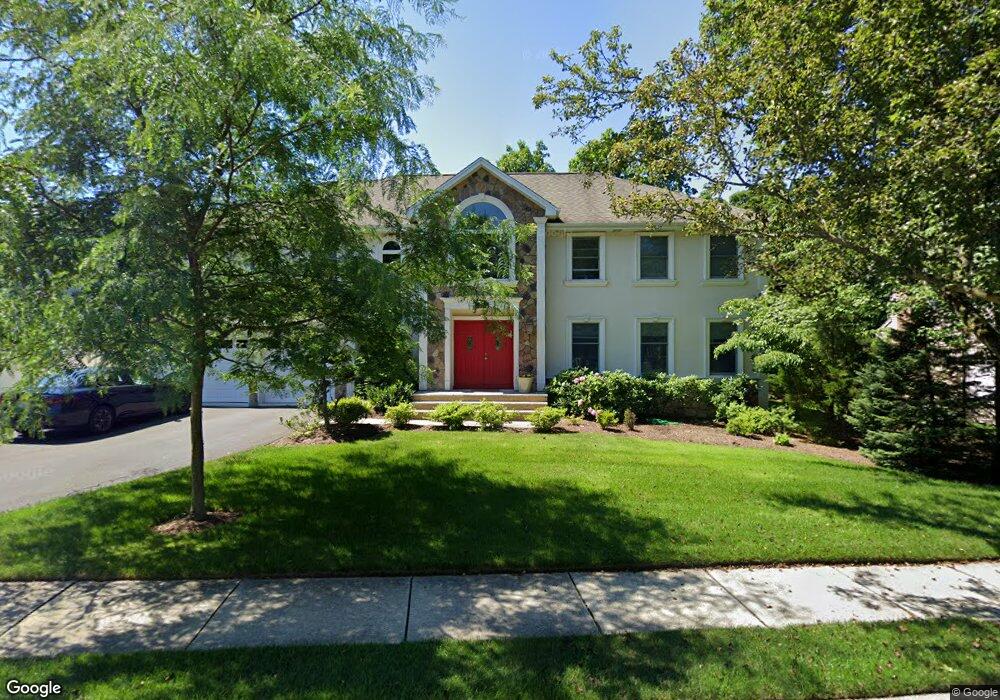
10 Heaton Ct Closter, NJ 07624
Estimated Value: $1,604,000 - $1,897,000
6
Beds
5
Baths
3,506
Sq Ft
$510/Sq Ft
Est. Value
About This Home
This home is located at 10 Heaton Ct, Closter, NJ 07624 and is currently estimated at $1,787,326, approximately $509 per square foot. 10 Heaton Ct is a home located in Bergen County with nearby schools including Hillside Elementary School, Tenakill Middle School, and Northern Valley Regional High School at Demarest.
Ownership History
Date
Name
Owned For
Owner Type
Purchase Details
Closed on
Aug 9, 2021
Sold by
Harlev Ohad and Harlev Hagit Pazgal
Bought by
Tadmor Erez and Tadmor Dikla
Current Estimated Value
Home Financials for this Owner
Home Financials are based on the most recent Mortgage that was taken out on this home.
Original Mortgage
$1,004,000
Outstanding Balance
$908,919
Interest Rate
2.61%
Mortgage Type
New Conventional
Estimated Equity
$878,407
Purchase Details
Closed on
Jun 2, 2015
Sold by
Clark William C and Clark Dana
Bought by
Harlev Ohad and Harlev Hagit Pazgal
Home Financials for this Owner
Home Financials are based on the most recent Mortgage that was taken out on this home.
Original Mortgage
$740,000
Interest Rate
3%
Mortgage Type
New Conventional
Purchase Details
Closed on
May 3, 1995
Sold by
J A Construction Co
Bought by
Clark William and Clark Dana
Home Financials for this Owner
Home Financials are based on the most recent Mortgage that was taken out on this home.
Original Mortgage
$200,000
Interest Rate
8.31%
Create a Home Valuation Report for This Property
The Home Valuation Report is an in-depth analysis detailing your home's value as well as a comparison with similar homes in the area
Home Values in the Area
Average Home Value in this Area
Purchase History
| Date | Buyer | Sale Price | Title Company |
|---|---|---|---|
| Tadmor Erez | $1,270,000 | Old Republic Natl Ttl Ins Co | |
| Harlev Ohad | $925,000 | Chicago Title | |
| Clark William | $543,000 | -- |
Source: Public Records
Mortgage History
| Date | Status | Borrower | Loan Amount |
|---|---|---|---|
| Open | Tadmor Erez | $1,004,000 | |
| Previous Owner | Harlev Ohad | $740,000 | |
| Previous Owner | Clark William | $200,000 |
Source: Public Records
Tax History
| Year | Tax Paid | Tax Assessment Tax Assessment Total Assessment is a certain percentage of the fair market value that is determined by local assessors to be the total taxable value of land and additions on the property. | Land | Improvement |
|---|---|---|---|---|
| 2025 | $28,665 | $1,465,100 | $783,400 | $681,700 |
| 2024 | $26,504 | $1,354,700 | $703,400 | $651,300 |
| 2023 | $25,332 | $1,236,200 | $602,200 | $634,000 |
| 2022 | $25,332 | $1,145,200 | $537,800 | $607,400 |
| 2021 | $22,614 | $981,500 | $473,400 | $508,100 |
| 2020 | $22,242 | $992,500 | $475,900 | $516,600 |
| 2019 | $21,649 | $976,500 | $468,400 | $508,100 |
| 2018 | $22,770 | $1,022,900 | $461,400 | $561,500 |
| 2017 | $23,108 | $1,012,600 | $439,700 | $572,900 |
| 2016 | $22,345 | $998,000 | $439,700 | $558,300 |
| 2015 | $23,008 | $1,050,600 | $439,700 | $610,900 |
| 2014 | $22,367 | $1,050,600 | $439,700 | $610,900 |
Source: Public Records
Map
Nearby Homes
- 8 Heaton Ct
- 268 Piermont Rd Unit N
- 268 Piermont Rd Unit S
- 284 Piermont Rd
- 11 Heaton Ct
- 290 Piermont Rd
- 6 Heaton Ct
- 9 Heaton Ct
- 7 Heaton Ct
- 8 Wilson Place
- 296 Piermont Rd
- 269 Piermont Rd
- 244 Piermont Rd
- 5 Heaton Ct
- 7 Wilson Place
- 4 Heaton Ct
- 235 Piermont Rd
- 275 Piermont Rd
- 18 Wilson Place
- 33 Parkside Ln
Your Personal Tour Guide
Ask me questions while you tour the home.