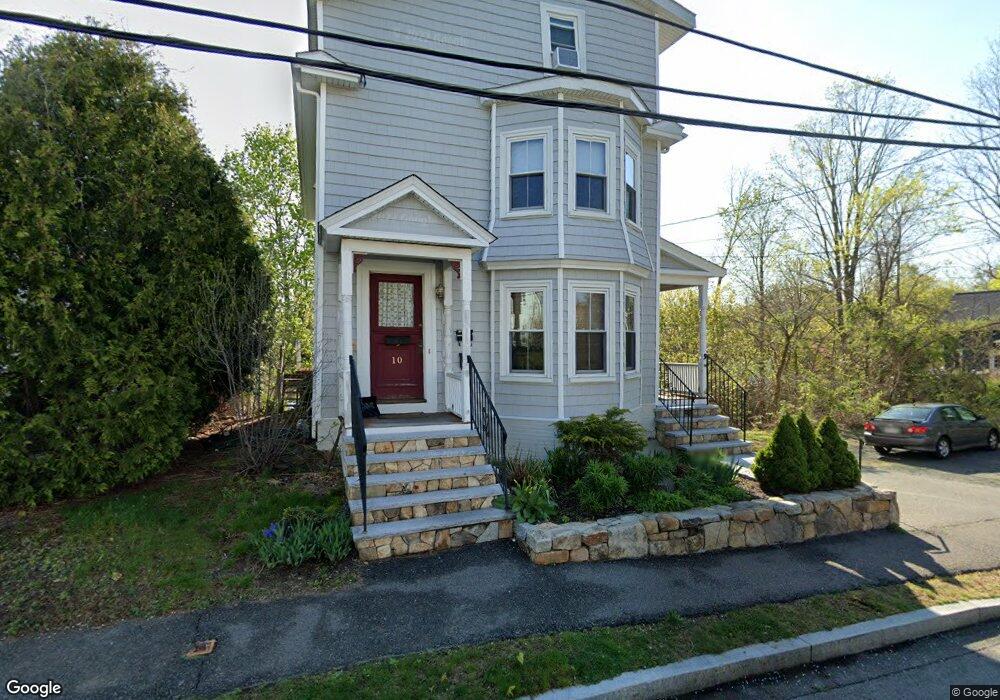
10 High St Natick, MA 01760
Estimated Value: $816,000 - $1,014,000
4
Beds
4
Baths
2,280
Sq Ft
$416/Sq Ft
Est. Value
About This Home
This home is located at 10 High St, Natick, MA 01760 and is currently estimated at $949,181, approximately $416 per square foot. 10 High St is a home located in Middlesex County with nearby schools including Natick High School, Johnson Elementary School, and J F Kennedy Middle School.
Ownership History
Date
Name
Owned For
Owner Type
Purchase Details
Closed on
Dec 16, 2021
Sold by
Lunny Kathleen M
Bought by
10 High Street Llc
Current Estimated Value
Purchase Details
Closed on
Nov 30, 2020
Sold by
Salvia James N
Bought by
Lunny Kathleen M
Home Financials for this Owner
Home Financials are based on the most recent Mortgage that was taken out on this home.
Original Mortgage
$562,500
Interest Rate
2.8%
Mortgage Type
New Conventional
Purchase Details
Closed on
Dec 6, 2002
Sold by
Plugis John T and Plugis Debra A
Bought by
Salvia James N
Home Financials for this Owner
Home Financials are based on the most recent Mortgage that was taken out on this home.
Original Mortgage
$387,600
Interest Rate
6.34%
Mortgage Type
Purchase Money Mortgage
Create a Home Valuation Report for This Property
The Home Valuation Report is an in-depth analysis detailing your home's value as well as a comparison with similar homes in the area
Home Values in the Area
Average Home Value in this Area
Purchase History
| Date | Buyer | Sale Price | Title Company |
|---|---|---|---|
| 10 High Street Llc | -- | None Available | |
| Lunny Kathleen M | $750,000 | None Available | |
| Salvia James N | $408,000 | -- |
Source: Public Records
Mortgage History
| Date | Status | Borrower | Loan Amount |
|---|---|---|---|
| Previous Owner | Lunny Kathleen M | $562,500 | |
| Previous Owner | Salvia James N | $387,600 |
Source: Public Records
Tax History
| Year | Tax Paid | Tax Assessment Tax Assessment Total Assessment is a certain percentage of the fair market value that is determined by local assessors to be the total taxable value of land and additions on the property. | Land | Improvement |
|---|---|---|---|---|
| 2025 | $10,957 | $916,100 | $462,900 | $453,200 |
| 2024 | $10,529 | $858,800 | $437,300 | $421,500 |
| 2023 | $10,317 | $816,200 | $410,400 | $405,800 |
| 2022 | $9,900 | $742,100 | $373,400 | $368,700 |
| 2021 | $9,478 | $696,400 | $352,900 | $343,500 |
| 2020 | $8,840 | $649,500 | $322,300 | $327,200 |
| 2019 | $8,255 | $649,500 | $322,300 | $327,200 |
| 2018 | $7,840 | $600,800 | $306,900 | $293,900 |
| 2017 | $7,388 | $547,700 | $273,600 | $274,100 |
| 2016 | $7,002 | $516,000 | $258,600 | $257,400 |
| 2015 | $7,155 | $517,700 | $258,600 | $259,100 |
Source: Public Records
Map
Nearby Homes
- 7 High St
- 5 Reynolds Ave Unit 2
- 63 Pond St
- 6 Floral Avenue Extension
- 89 W Central St
- 25 Forest Ave
- 12 Floral Ave
- 49 Summer St
- 45 Summer St
- 9 Bellevue Rd
- 16 West St
- 62 Oakland St
- 14 Pinewood Ave
- 6A Lincoln St Unit 6A
- 10 Lincoln St Unit 10
- 4B Lincoln St Unit 4B
- 216-218 S Main St
- 3A Wilson St Unit 3A
- 3 Wilson St Unit 3B
- 11 Avon St
Your Personal Tour Guide
Ask me questions while you tour the home.