
Landlord's Agent in 2025
Liz Squillacote
William Pitt
(860) 922-7017
10 in this area
96 Total Sales
Estimated Value: $542,411 - $714,000
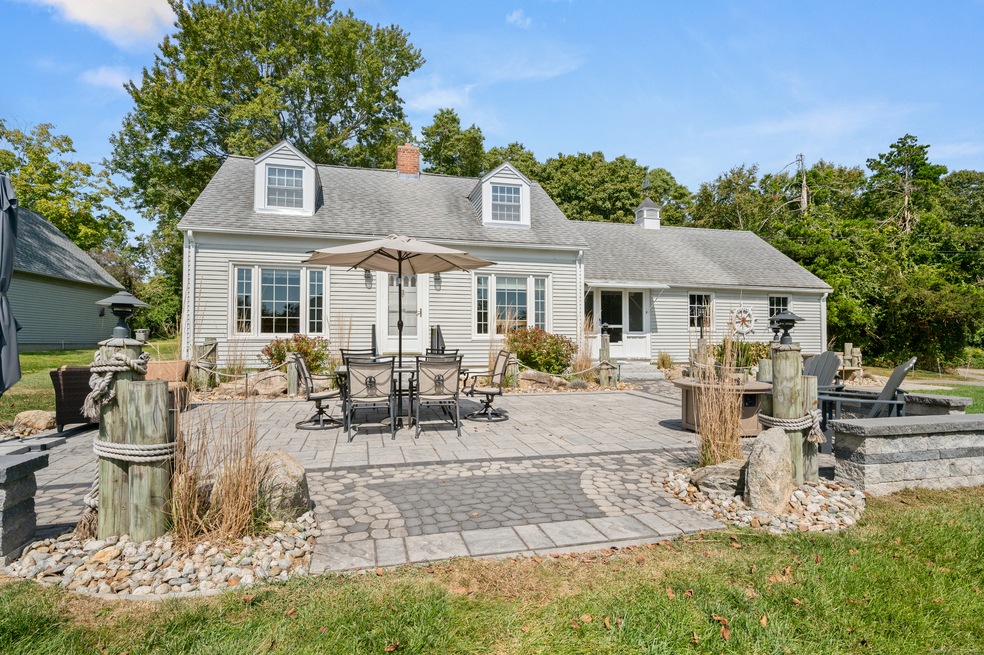
Charming 3 bedroom home available as an academic / winter furnished rental in beautiful Giants Neck Beach Assoc. Enjoy water views from inside or outside from the expansive patio on this expansive private lot at the end of the street. An easy walk to the beach, relax and unwind in this home featuring hardwood floors, a bright and inviting layout, comfortable furnishings and a wonderful three season porch. The main level features a laundry room and full bathroom in addition to the open kitchen / dinning area and living room. Upstairs there are three bedrooms and a full bath. Internet, water & lawn maintenance are provided by the landlord. Tenants will be responsible for heat (oil), electricity and snow removal.
Last Agent to Rent the Property
William Pitt Sotheby's Int'l Brokerage Phone: (860) 922-7017 License #RES.0812916 Listed on: 08/25/2025
Last Renter's Agent
William Pitt Sotheby's Int'l Brokerage Phone: (860) 922-7017 License #RES.0812916 Listed on: 08/25/2025
| Date | Event | Price | List to Sale | Price per Sq Ft |
|---|---|---|---|---|
| 11/17/2025 11/17/25 | Rented | $2,000 | 0.0% | -- |
| 11/01/2025 11/01/25 | Under Contract | -- | -- | -- |
| 08/25/2025 08/25/25 | For Rent | $2,000 | +14.3% | -- |
| 09/15/2021 09/15/21 | Rented | $1,750 | 0.0% | -- |
| 09/13/2021 09/13/21 | Under Contract | -- | -- | -- |
| 08/26/2021 08/26/21 | For Rent | $1,750 | +6.1% | -- |
| 09/12/2020 09/12/20 | Rented | $1,650 | 0.0% | -- |
| 08/27/2020 08/27/20 | For Rent | $1,650 | -- | -- |
| Year | Tax Paid | Tax Assessment Tax Assessment Total Assessment is a certain percentage of the fair market value that is determined by local assessors to be the total taxable value of land and additions on the property. | Land | Improvement |
|---|---|---|---|---|
| 2025 | $7,080 | $252,770 | $146,790 | $105,980 |
| 2024 | $6,660 | $252,770 | $146,790 | $105,980 |
| 2023 | $6,289 | $252,770 | $146,790 | $105,980 |
| 2022 | $6,026 | $252,770 | $146,790 | $105,980 |
| 2021 | $5,975 | $209,580 | $141,680 | $67,900 |
| 2020 | $5,944 | $209,580 | $141,680 | $67,900 |
| 2019 | $5,908 | $209,580 | $141,680 | $67,900 |
| 2018 | $5,732 | $209,580 | $141,680 | $67,900 |
| 2017 | $5,483 | $209,580 | $141,680 | $67,900 |
| 2016 | $5,148 | $203,000 | $131,600 | $71,400 |
| 2015 | $5,016 | $203,000 | $131,600 | $71,400 |
| 2014 | $4,878 | $203,000 | $131,600 | $71,400 |
Landlord's Agent in 2025
Liz Squillacote
William Pitt
(860) 922-7017
10 in this area
96 Total Sales
Buyer's Agent in 2021
Matt Diamond
Houlihan Lawrence WD
(860) 391-9461
2 in this area
54 Total Sales
Buyer's Agent in 2020
Nancy Mesham
Coldwell Banker Realty
(860) 227-9071
25 in this area
169 Total Sales
Source: SmartMLS
MLS Number: 24121835
APN: ELYM-004010-000031
Disclaimer: Certain information contained herein is derived from information provided by parties other than Homes.com. All information provided is deemed reliable, but is not guaranteed to be accurate and should be independently verified.
![]() IDX information is provided exclusively for personal, non-commercial use, and may not be used for any purpose other than to identify prospective properties consumers may be interested in purchasing. Information is deemed reliable but not guaranteed.
IDX information is provided exclusively for personal, non-commercial use, and may not be used for any purpose other than to identify prospective properties consumers may be interested in purchasing. Information is deemed reliable but not guaranteed.