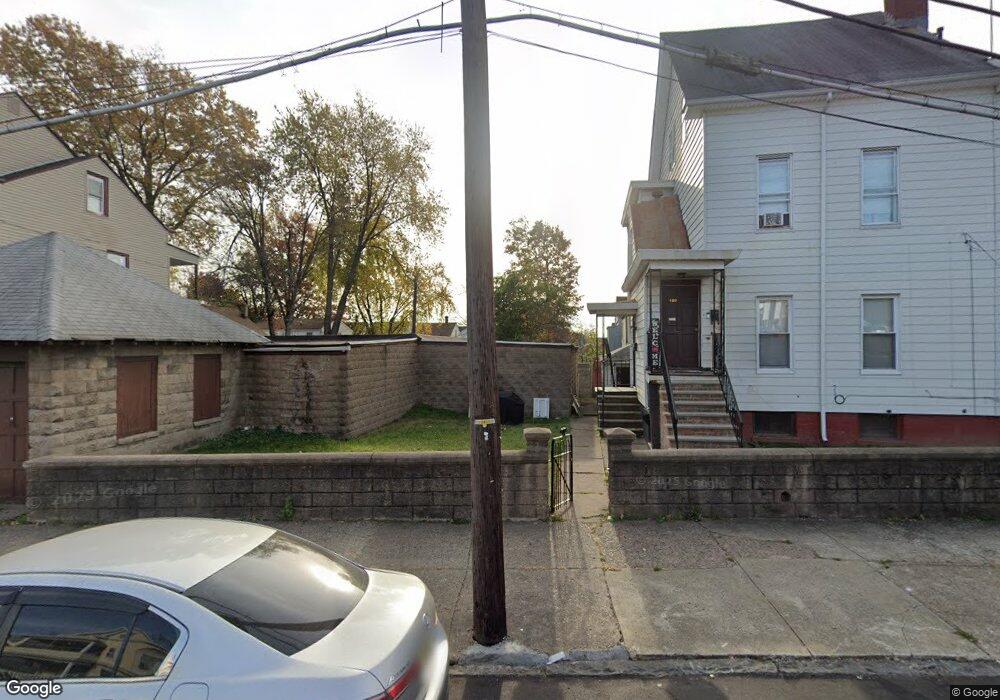
10 Hopper St Unit 2 Paterson, NJ 07522
Northside NeighborhoodEstimated Value: $138,000
--
Bed
1
Bath
1,176
Sq Ft
$117/Sq Ft
Est. Value
About This Home
This home is located at 10 Hopper St Unit 2, Paterson, NJ 07522 and is currently estimated at $138,000, approximately $117 per square foot. 10 Hopper St Unit 2 is a home located in Passaic County with nearby schools including Edward W. Kilpatrick School of Discovery, Dale Avenue Elementary School, and Dr. Frank Napier, Jr. School of Technology.
Ownership History
Date
Name
Owned For
Owner Type
Purchase Details
Closed on
Jul 6, 2022
Sold by
10-16 Hopper Llc
Bought by
Estrella Leandrina Hernandez
Current Estimated Value
Purchase Details
Closed on
Mar 21, 2022
Sold by
10-16 Hopper Llc
Bought by
10-16 Hopper Llc
Purchase Details
Closed on
Jan 27, 2020
Sold by
Sobh Carol
Bought by
10 16 Hopper Llc
Home Financials for this Owner
Home Financials are based on the most recent Mortgage that was taken out on this home.
Original Mortgage
$150,000
Interest Rate
3.6%
Mortgage Type
Commercial
Purchase Details
Closed on
Dec 28, 2018
Sold by
Manufa Cturers And Traders Trust Company
Bought by
Sobh Carol
Purchase Details
Closed on
Jan 22, 2018
Sold by
Rivera Maritaza and Rivera Robert
Bought by
Manufacturers And Traders Trust Co and M And T Bank
Create a Home Valuation Report for This Property
The Home Valuation Report is an in-depth analysis detailing your home's value as well as a comparison with similar homes in the area
Home Values in the Area
Average Home Value in this Area
Purchase History
| Date | Buyer | Sale Price | Title Company |
|---|---|---|---|
| Estrella Leandrina Hernandez | $525,000 | Stewart Title | |
| 10-16 Hopper Llc | -- | New Title Company Name | |
| 10 16 Hopper Llc | -- | Town Title Agency Llc | |
| Sobh Carol | $24,900 | Servicelink | |
| Manufacturers And Traders Trust Co | -- | None Available |
Source: Public Records
Mortgage History
| Date | Status | Borrower | Loan Amount |
|---|---|---|---|
| Previous Owner | 10 16 Hopper Llc | $150,000 |
Source: Public Records
Tax History Compared to Growth
Tax History
| Year | Tax Paid | Tax Assessment Tax Assessment Total Assessment is a certain percentage of the fair market value that is determined by local assessors to be the total taxable value of land and additions on the property. | Land | Improvement |
|---|---|---|---|---|
| 2025 | -- | -- | -- | -- |
| 2024 | -- | $0 | $0 | $0 |
| 2023 | $4,549 | $0 | $0 | $0 |
| 2022 | $4,549 | $98,000 | $31,100 | $66,900 |
| 2021 | $4,386 | $98,000 | $31,100 | $66,900 |
| 2020 | $4,092 | $98,000 | $31,100 | $66,900 |
| 2019 | $3,965 | $95,900 | $30,600 | $65,300 |
| 2018 | $4,092 | $94,600 | $30,300 | $64,300 |
| 2017 | $3,910 | $94,000 | $30,200 | $63,800 |
| 2016 | $4,300 | $99,100 | $31,700 | $67,400 |
| 2015 | $4,071 | $99,100 | $31,700 | $67,400 |
| 2014 | $8,045 | $277,400 | $157,500 | $119,900 |
Source: Public Records
Map
Nearby Homes
- 10 Hopper St Unit 16
- 10-16-16 Hopper St Unit 2
- 100-102 Haledon Ave
- 12 Hopper St Unit 16
- 12 Hopper St Unit 2
- 14 Hopper St
- 98 Haledon Ave
- 10-16 Hopper St Unit 2
- 10-16 Hopper St
- 16 Hopper St
- 96 Haledon Ave
- 100 Haledon Ave Unit 102
- 100 Haledon Ave
- 13 Hopper St
- 11 Hopper St
- 94 Haledon Ave
- 9 Hopper St
- 15 Hopper St
- 92 Haledon Ave
- 18 Hopper St Unit 24